

Astrocyte elevated gene-1 regulates hepatocellular carcinoma development and progression
- PMID: 19221438
- PMCID: PMC2648696
- DOI: 10.1172/JCI36460
Astrocyte elevated gene-1 regulates hepatocellular carcinoma development and progression
Abstract
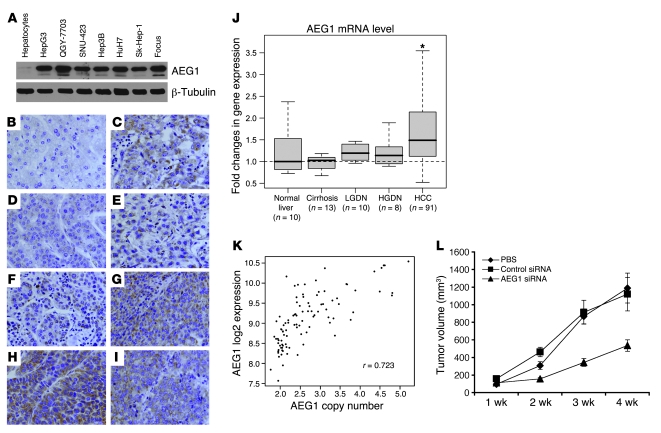
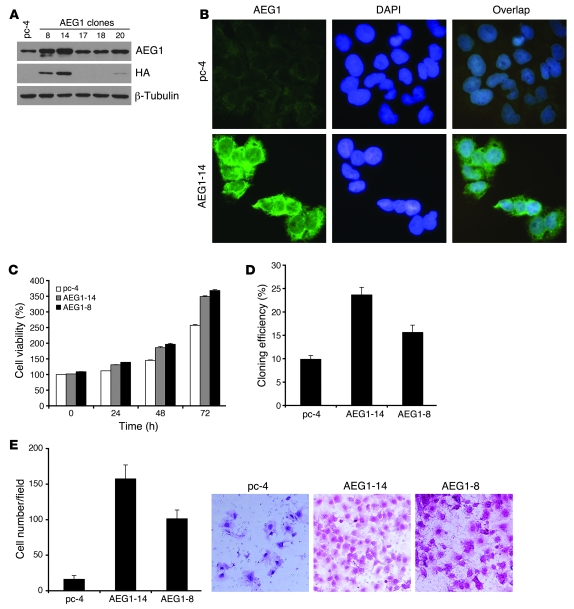
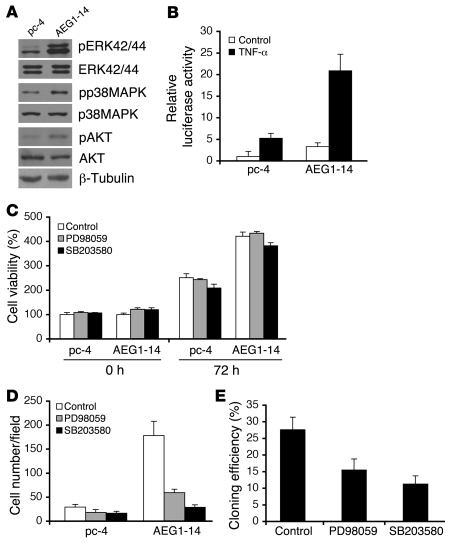
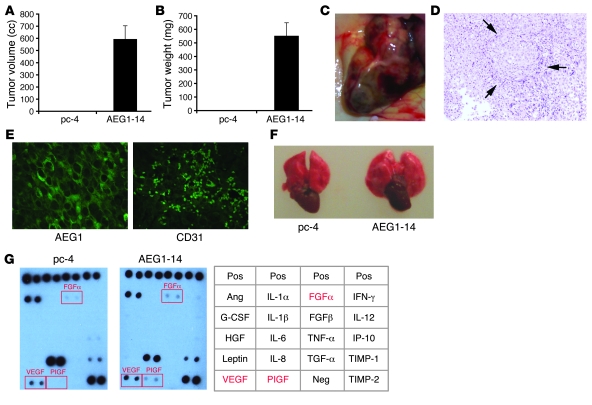
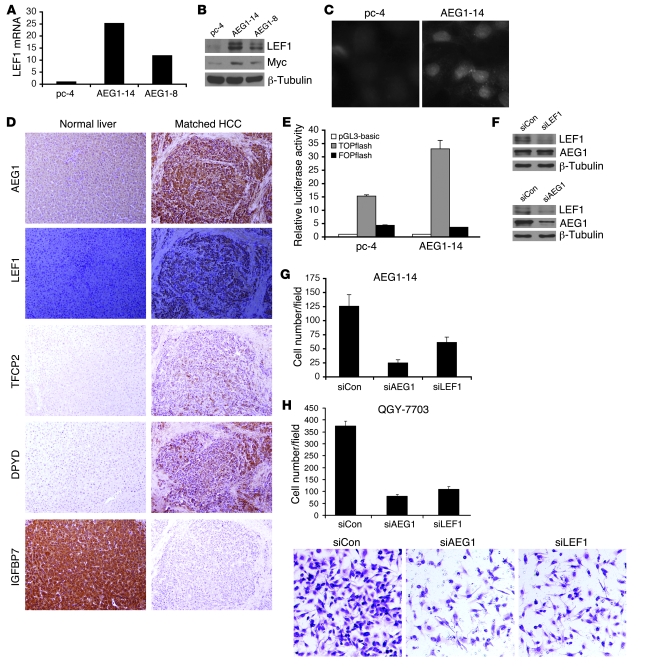
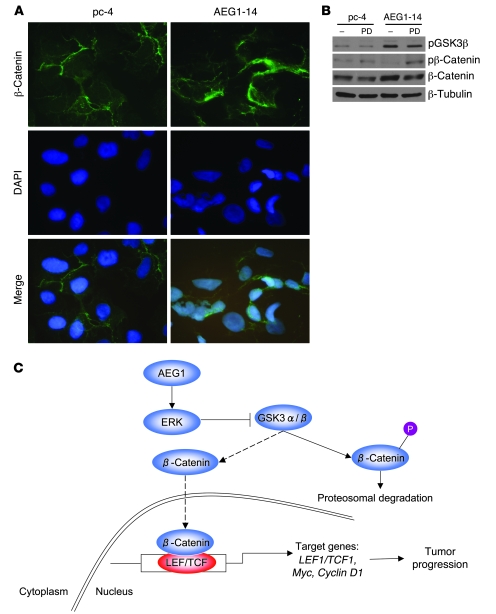
Hepatocellular carcinoma (HCC) is a highly aggressive vascular cancer characterized by diverse etiology, activation of multiple signal transduction pathways, and various gene mutations. Here, we have determined a specific role for astrocyte elevated gene-1 (AEG1) in HCC pathogenesis. Expression of AEG1 was extremely low in human hepatocytes, but its levels were significantly increased in human HCC. Stable overexpression of AEG1 converted nontumorigenic human HCC cells into highly aggressive vascular tumors, and inhibition of AEG1 abrogated tumorigenesis by aggressive HCC cells in a xenograft model of nude mice. In human HCC, AEG1 overexpression was associated with elevated copy numbers. Microarray analysis revealed that AEG1 modulated the expression of genes associated with invasion, metastasis, chemoresistance, angiogenesis, and senescence. AEG1 also was found to activate Wnt/beta-catenin signaling via ERK42/44 activation and upregulated lymphoid-enhancing factor 1/T cell factor 1 (LEF1/TCF1), the ultimate executor of the Wnt pathway, important for HCC progression. Inhibition studies further demonstrated that activation of Wnt signaling played a key role in mediating AEG1 function. AEG1 also activated the NF-kappaB pathway, which may play a role in the chronic inflammatory changes preceding HCC development. These data indicate that AEG1 plays a central role in regulating diverse aspects of HCC pathogenesis. Targeted inhibition of AEG1 might lead to the shutdown of key elemental characteristics of HCC and could lead to an effective therapeutic strategy for HCC.
Figures
Similar articles
-
Astrocyte elevated gene-1 promotes hepatocarcinogenesis: novel insights from a mouse model.Hepatology. 2012 Nov;56(5):1782-91. doi: 10.1002/hep.25868. Hepatology. 2012. PMID: 22689379 Free PMC article.
-
Insulin-like growth factor-binding protein-7 functions as a potential tumor suppressor in hepatocellular carcinoma.Clin Cancer Res. 2011 Nov 1;17(21):6693-701. doi: 10.1158/1078-0432.CCR-10-2774. Epub 2011 Sep 9. Clin Cancer Res. 2011. PMID: 21908579 Free PMC article.
-
Long noncoding RNA LEF1-AS1 acts as a microRNA-10a-5p regulator to enhance MSI1 expression and promote chemoresistance in hepatocellular carcinoma cells through activating AKT signaling pathway.J Cell Biochem. 2021 Jan;122(1):86-99. doi: 10.1002/jcb.29833. Epub 2020 Aug 12. J Cell Biochem. 2021. PMID: 32786108
-
Silencing of long noncoding RNA LEF1-AS1 prevents the progression of hepatocellular carcinoma via the crosstalk with microRNA-136-5p/WNK1.J Cell Physiol. 2020 Oct;235(10):6548-6562. doi: 10.1002/jcp.29503. Epub 2020 Feb 18. J Cell Physiol. 2020. PMID: 32068261
-
The emerging role of astrocyte-elevated gene-1 in hepatocellular carcinoma (Review).Oncol Rep. 2015 Aug;34(2):539-46. doi: 10.3892/or.2015.4024. Epub 2015 May 29. Oncol Rep. 2015. PMID: 26035424 Review.
Cited by
-
Metadherin is a prognostic predictor of hepatocellular carcinoma after curative hepatectomy.Gut Liver. 2013 Mar;7(2):206-12. doi: 10.5009/gnl.2013.7.2.206. Epub 2013 Feb 7. Gut Liver. 2013. PMID: 23560157 Free PMC article.
-
The Scope of Astrocyte Elevated Gene-1/Metadherin (AEG-1/MTDH) in Cancer Clinicopathology: A Review.Genes (Basel). 2021 Feb 22;12(2):308. doi: 10.3390/genes12020308. Genes (Basel). 2021. PMID: 33671513 Free PMC article. Review.
-
Dysregulation of miR-375/AEG-1 Axis by Human Papillomavirus 16/18-E6/E7 Promotes Cellular Proliferation, Migration, and Invasion in Cervical Cancer.Front Oncol. 2019 Sep 9;9:847. doi: 10.3389/fonc.2019.00847. eCollection 2019. Front Oncol. 2019. PMID: 31552174 Free PMC article.
-
CCL18 promotes the metastasis of squamous cell carcinoma of the head and neck through MTDH-NF-κB signalling pathway.J Cell Mol Med. 2019 Apr;23(4):2689-2701. doi: 10.1111/jcmm.14168. Epub 2019 Feb 15. J Cell Mol Med. 2019. PMID: 30768878 Free PMC article.
-
Identification of novel variants of metadherin in breast cancer.PLoS One. 2011 Mar 8;6(3):e17582. doi: 10.1371/journal.pone.0017582. PLoS One. 2011. PMID: 21408129 Free PMC article.
References
-
- El-Serag H.B., Davila J.A., Petersen N.J., McGlynn K.A. The continuing increase in the incidence of hepatocellular carcinoma in the United States: an update. Ann. Intern. Med. 2003;139:817–823. - PubMed
Publication types
MeSH terms
Substances
Grants and funding
LinkOut - more resources
Full Text Sources
Other Literature Sources
Medical
