. 2009 Mar 1;8(5):765-72.
doi: 10.4161/cc.8.5.7879. Epub 2009 Mar 18.

Benzo[e]pyridoindoles, novel inhibitors of the aurora kinases

Affiliations

Benzo[e]pyridoindoles, novel inhibitors of the aurora kinases

Thi My-Nhung Hoang et al. Cell Cycle. .

Abstract

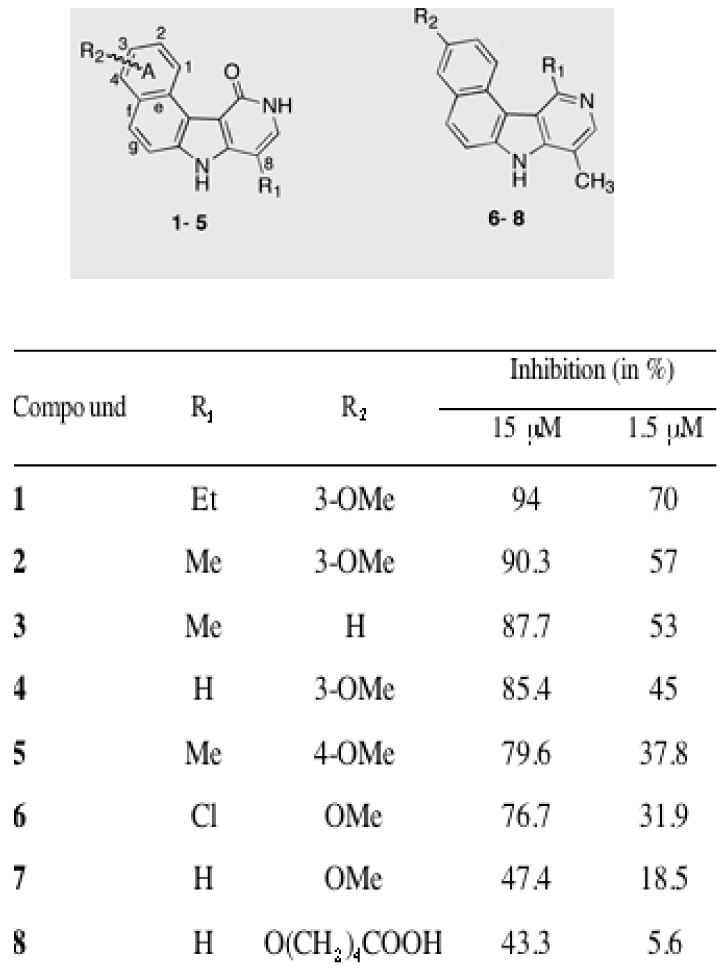
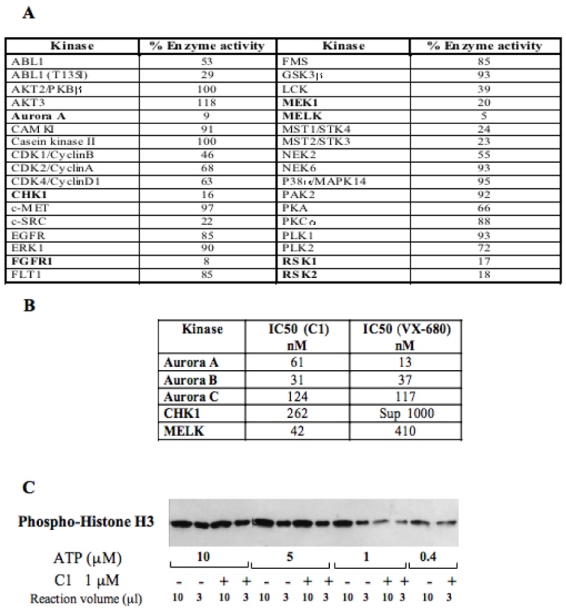
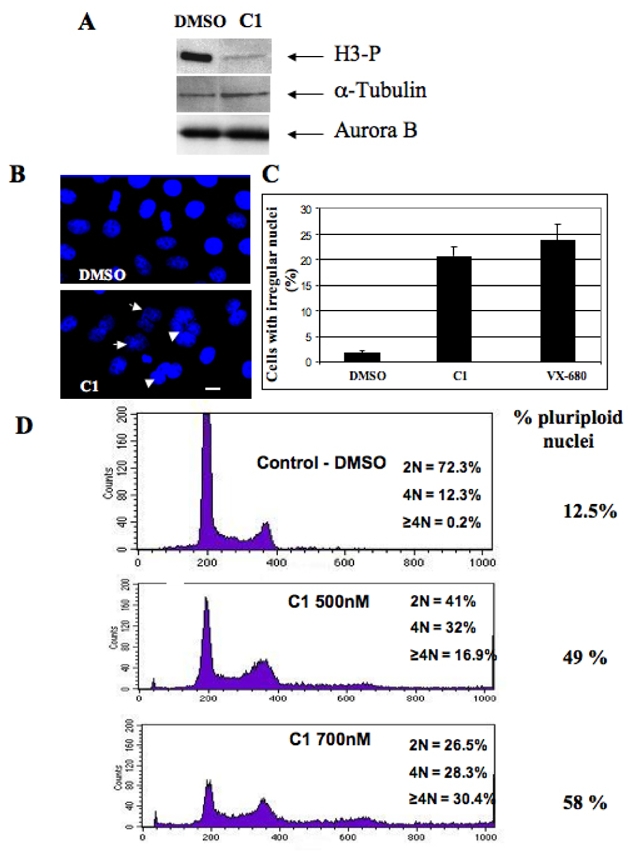
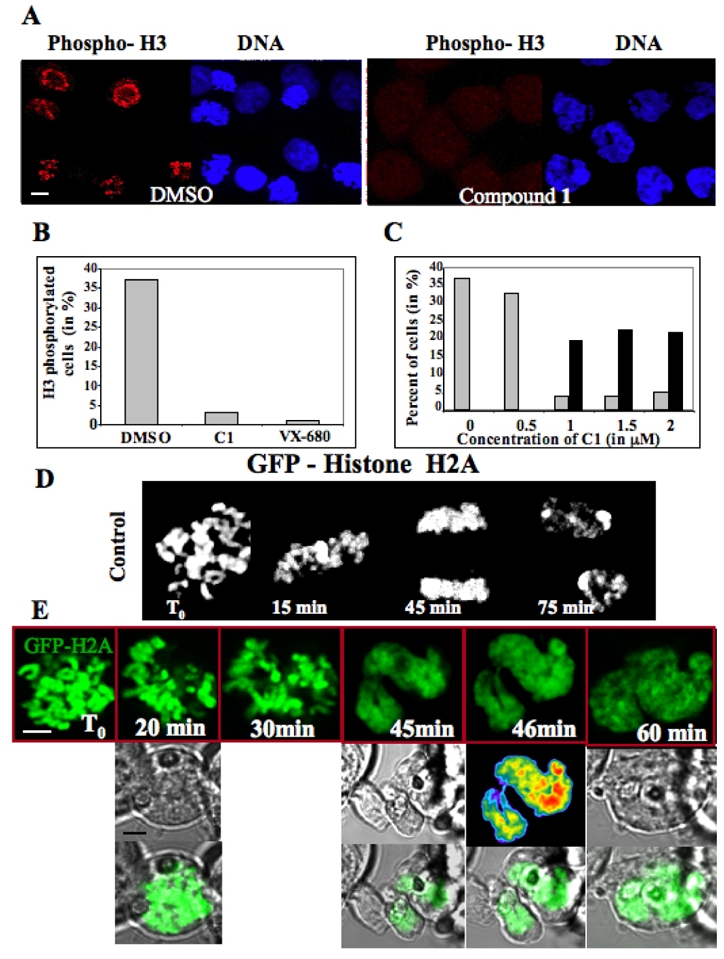
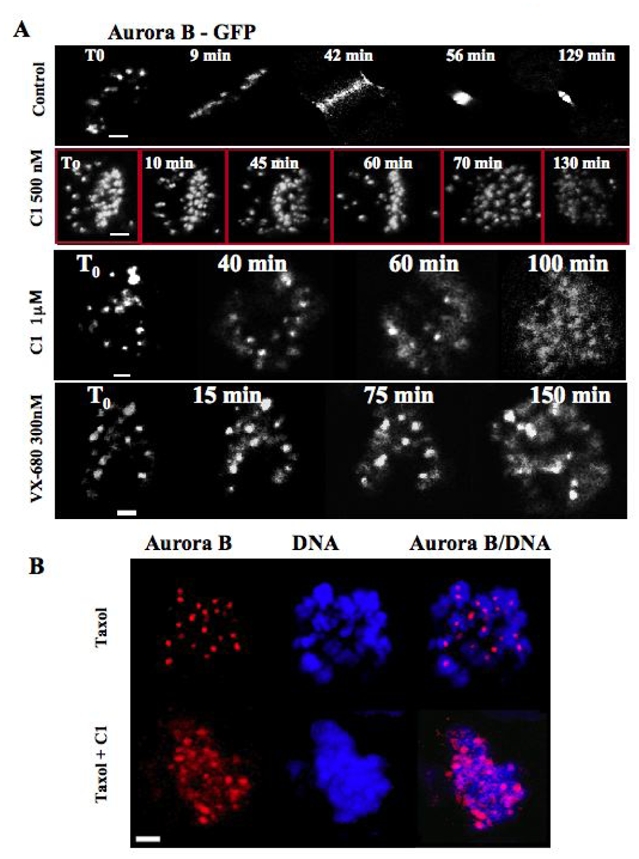
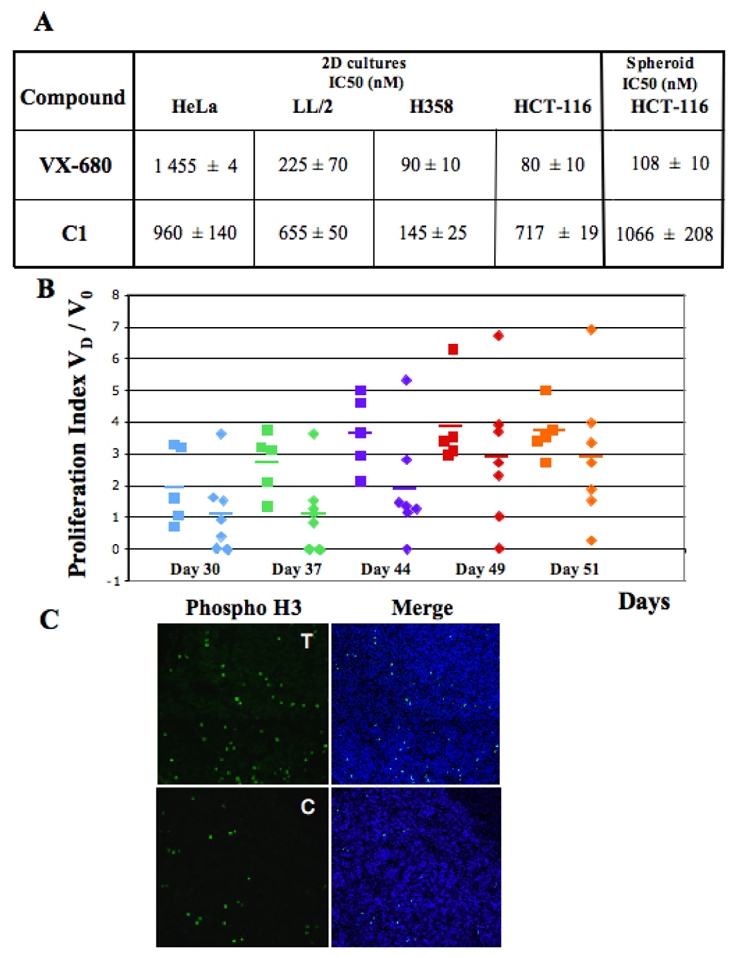
Aurora kinases are serine/threonine protein kinases that are involved in cancer development and are important targets for cancer therapy. By high throughput screening of a chemical library we found that benzo[e]pyridoindole derivatives inhibited Aurora kinase. The most potent compound (compound 1) was found to be an ATP competitive inhibitor, which inhibited in vitro Aurora kinases at the nanomolar range. It prevented, ex vivo, the phosphorylation of Histone H3, induced mitosis exit without chromosome segregation, known phenomena observed upon Aurora B inactivation. This compound was also shown to affect the localization of Aurora B, since in the presence of the inhibitor the enzyme was delocalized on the whole chromosomes and remained associated with the chromatin of newly formed nuclei. In addition, compound 1 inhibited the growth of different cell lines derived from different carcinoma. Its IC(50) for H358 NSCLC (Non Small Cancer Lung Cells), the most sensitive cell line, was 145 nM. Furthermore compound 1 was found to be efficient towards multicellular tumor spheroid growth. It exhibited minimal toxicity in mice while it had some potency towards aggressive NSCLC tumors. Benzo[e]pyridoindoles represent thus a potential new lead for the development of Aurora kinase inhibitors.


Figures

Figure 1
Figure 1. Novel Aurora kinase inhibitors identified by high throughput screening
The chemical structure and the preferential conformations of the identified eight most potent hits are presented. The inhibitory efficiency (percent of inhibition) towards the kinase domain of Aurora A for each hit at 15 μm and 1.5 μM are also shown.
Figure 2
Figure 2. Kinase inhibition selectivity of C1
(A) C1 kinase profiling. 36 recombinant kinases were used in the study. The percentage of the remaining kinase activity measured upon treatment with 1 μM C1 in a solution containing 1 μM ATP is presented. Kinases, inhibited by more than 80 %, are indicated in bold. (B) IC50 values for the five best kinase targets of C1. For comparison the IC50 for VX-680 for the same kinases is also shown. The measurements of IC50 for both compounds were carried out under identical conditions. (C) Western blot analysis of the effect of C1 on the phosphorylation of histone H3 by Aurora A domain kinase. A kinase assay was carried out either in absence (−) or in the presence (+) of C1 (1μM) and at decreasing concentrations of ATP. Each reaction contained the same amount of histone H3. After completion of the reaction, 10 and 3 μl of the reaction mixtures containing either 10, or 5 or 1μM ATP were run on an SDS gel (for the reaction carried out in the presence of 0.4 μM ATP, an aliquot of only 10 μl was run). After blotting, the phosphorylation of histone H3 was revealed by a specific antibody against the phosphorylated histone H3.
Figure 3
Figure 3. Effect of C1 in HeLa cells
(A) Western blot analysis of histone H3 phosphorylation. HeLa cells were incubated overnight with Nocodazole (50 nM) in the presence of either DMSO or C1 (2 μM). Cells were then collected and lysed. Identical amounts of the lysed cell samples were run on 18% acrylamide gel containing SDS. After transfer, the blot was revealed using an antibody against phosphorylated histone H3. The same membrane was also revealed using antibodies against α-tubulin and Aurora B for estimation of both the amount of loaded proteins and of mitotic cells, respectively. (B) Treatment with C1 resulted in perturbation of the structure of the cell nuclei. HeLa cells were incubated overnight in the presence of either C1 (2 μM) or DMSO (1%). Nuclei were stained with Hoechst 33 342 and visualized by fluorescence microscopy. Arrows indicate irregular nuclei. Similar perturbations in the nuclear structure were obtained upon treatment with 300 nM VX-680 (not shown). Bar, 5 microns. (C) Quantification of the data presented in (B). The percentage of irregular (lobed and polyploid) nuclei was determined in two independent experiments; 100 cells were analyzed per experiment. (D) FACS analysis shows that treatment with C1 results in a dramatic increase of the amount of polyploid cells. The experiments were performed with control HeLa cells (incubated only in the presence of 1% DMSO) and HeLa cells incubated with C1 (at either 500 nM or 700 nM) for 48 hours. DNA was stained with propidium iodine and the samples were analyzed by using a Beckton-Dickinson FACS analyzer. The percentage of polyploid cells (cells with a ploidy ≥2N) is indicated on the right part of the figure.
Figure 4
Figure 4. Effects of C1 on mitotic cells
(A) Visualization of the phosphorylation status of histone H3 in paclitaxel (33 nM) treated cells in the presence of either DMSO or C1. H3 phosphorylation (red) was visualised by a specific antibody and DNA (blue) was stained by Hoechst 33342. Similar results were obtained with VX-680 (not shown). The bar, 5 μm. (B) Quantification of the data presented in (A). 500 cells were analysed in each experiment and the data of two independent experiments are shown. (C) Treatment with C1 induces mitotic slippage. HeLa cells were arrested in mitosis by overnight incubation in paclitaxel (33 nM). The cells were then incubated with the indicated concentrations of C1 for two additional hours and fixed. Mitotic and polyploid cells were scored. ~100 nuclei were analysed in two different experiments; grey, mitotic cells; black, cells with polylobed nuclei. (D) Time-lapse microscopy of a stable mitotic HEK-293 cell expressing GFP-H2A histone fusion. (E) Time-lapse microscopy of C1 treated mitotic HEK-293 cells stably expressing GFP-H2A. C1 (1 μM final concentration) was added to the overnight paclitaxel (33 nM) treated cells and then the behaviour of the cell was continuously imaged. Representative photos, made at the indicated time points, are shown. The first, second and third rows present the fluorescent GFP signal, the transmission signal and the merge signal, respectively. The bar, 5 μm.
Figure 5
Figure 5. C1 induces the redistribution of Aurora B
(A) Time lapse microscopy of a mitotic stable HeLa cells expressing Aurora B-GFP fusion in the absence (control) or the presence of either C1 (at 500 nM or 1 μM) or VX-680 (300 nM). The compounds were added to the cell culture and then the behaviour of the cells was continuously imaged. Representative photos, made at the times indicated, are presented. Note that both C1 and VX-680 delayed mitosis onset. In addition, the treatment with 1 μM C1 as well as with VX-680 resulted in a partial delocalization of Aurora B-GFP on the entire chromosomes. (B) C1 treatment induces also the redistribution of endogenous Aurora B. Overnight paclitaxel (33 nM) treated HeLa cells were incubated for two hours with C1 (1 μM), fixed and analyzed by immunofluorescence microscopy. The localization of Aurora B (red) was detected by anti-Aurora B antibody. DNA (blue) was stained by Hoechst 33342. Note that the strictly punctuated pattern (exclusively centromeric localization) of Aurora B in the control (paxitaxel) cells is no longer observed in the C1 treated cells. Aurora B being partly diffused on chromatin.
Figure 6
Figure 6. Effects of C1 on cell viability in two-dimensional and three-dimensional culture conditions; Effect on mice bearing H358 tumours
(A) C1 and VX-680 IC50 for HeLa, LL/2, H358 and HCT-116 cells in culture (two-dimensional conditions) and for HCT-116 spheroids (3D conditions). Cell growth and viability were tested under standard conditions in 96 well culture plates with MTT (Promega) cell assay. The average of three independent experiments is shown. Note that similar IC50 were determined for C1 and VX-680 towards H358 cells. (B) Proliferation indexes of H358 tumor growth. Mice were injected with 2 ×10⁶ cells. Tumor dimensions were measured at days 7, 8, 30, 37, 44, 49 post-injection and the 20 proliferation index (the ratio Vd/V0, where Vd is the volume of the tumour at the respective day, and V0 is the average volume of the tumour calculated at day 7 and 8). Square: control mice; diamond: treated mice. The data for day 30 (D30) post-injection are in blue, D37 data are in green, D44 data are in violet, D49 data are in red and D51 in orange. Each point presents the proliferation index of one mouse tumour and the horizontal bars represent the average index of the series. (C) Histone H3 phosphorylation is decreased in C1 treated tumours. At day 51 post-injection the control and the C1 treated H358 tumour bearing cell mice were sacrificed and a small part of the tumours were immediately frozen. The phosphorylation status of histone H3 in frozen sections of the tumours of the control (C) or C1 treated mice (T) was visualized by using a specific anti-phosphorylated histone H3 antibody (in green). DNA (blue) was stained by Hoechst 33342. Merge (DNA plus phospo – histone H3) is shown.

Similar articles

Cited by

References

    1. Vader G, Lens SM. The aurora kinase family in cell division and cancer. Biochim biophys Acta. 2008;1786:60–72. - PubMed
    1. Ruchaud S, Carmena M, Earnshaw WC. Chromosomal passengers conducting cell division. Nat Rev Mol Cell Biol. 2007;8:798–812. - PubMed
    1. Sardon T, Peset I, Petrova B, Vernos I. Dissecting the role of Aurora A during spindle assembly. EMBO J. 2008;27:2567–79. - PMC - PubMed
    1. Hannak E, Kirkham M, Hyman AA, Oegema K. Aurora-A kinase is required for centrosome maturation in Caenorhabditis elegans. J Cell Biol. 2001;155:1109–16. - PMC - PubMed
    1. Seki A, Coppinger JA, Jang CY, Yates JR, Fang G. Bora and the kinase Aurora A cooperatively activate the kinase Plk1 and control mitotic entry. Science. 2008;320:1655–8. - PMC - PubMed

Publication types

MeSH terms