

Technical analysis of cDNA microarrays
- PMID: 19221589
- PMCID: PMC2637424
- DOI: 10.1371/journal.pone.0004486
Technical analysis of cDNA microarrays
Abstract
Background: There is extensive variation in gene expression among individuals within and between populations. Accurate measures of the variation in mRNA expression using microarrays can be confounded by technical variation, which includes variation in RNA isolation procedures, day of hybridization and methods used to amplify and dye label RNA for hybridization.
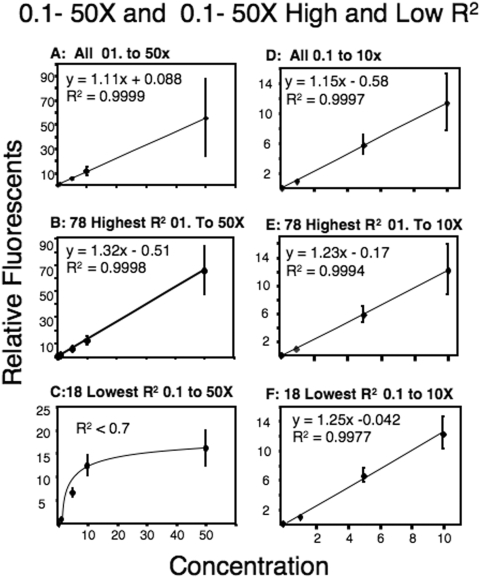
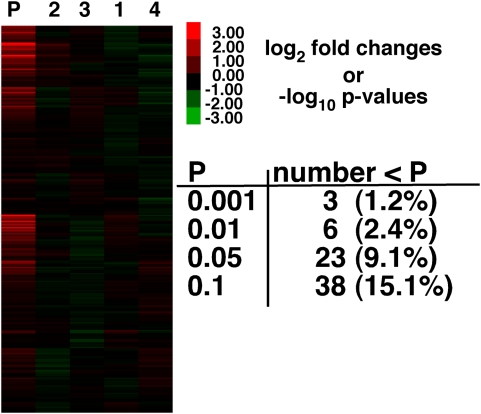
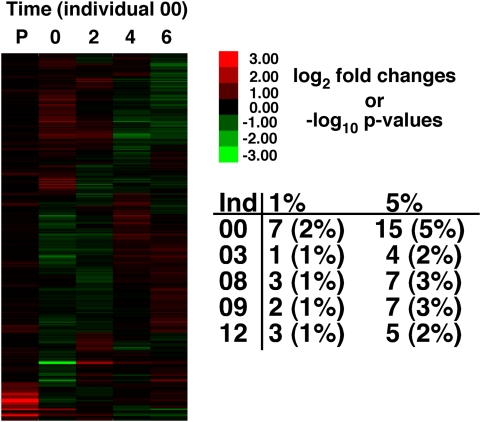
Methodology/principal findings: In this manuscript we analyze the relationship between the amount of mRNA and the fluorescent signal from the microarray hybridizations demonstrating that for a wide-range of mRNA concentrations the fluorescent signal is a linear function of the amount of mRNA. Additionally, the separate isolation, labeling or hybridization of RNA does not add significant amounts of variation in microarray measures of gene expression. However, single or double rounds of amplification for labeling do have small but significant affects on 10% of genes, but this source of technical variation is easy to avoid. To examine both technical and stochastic biological variation, mRNA expression was measured from the same five individuals over a six-week time course.
Conclusion: There were few, if any, meaningful differences in gene expression among time points. Thus, microarray measures using standard laboratory procedures can be precise and quantitative and are not subject to significant random biological noise.
Conflict of interest statement
Figures
Similar articles
-
Application of four dyes in gene expression analyses by microarrays.BMC Genomics. 2005 Jul 25;6:101. doi: 10.1186/1471-2164-6-101. BMC Genomics. 2005. PMID: 16042794 Free PMC article.
-
Evaluation and optimization of procedures for target labeling and hybridization of cDNA microarrays.Mol Vis. 2002 Apr 26;8:130-7. Mol Vis. 2002. PMID: 12011805
-
An alternative method to amplify RNA without loss of signal conservation for expression analysis with a proteinase DNA microarray in the ArrayTube format.BMC Genomics. 2006 Jun 12;7:144. doi: 10.1186/1471-2164-7-144. BMC Genomics. 2006. PMID: 16768788 Free PMC article.
-
Gene expression analysis using cDNA microarrays.Curr Protoc Neurosci. 2002 Nov;Chapter 4:Unit 4.28. doi: 10.1002/0471142301.ns0428s20. Curr Protoc Neurosci. 2002. PMID: 18428560 Review.
-
Gene expression profiling of primary tumor cell populations using laser capture microdissection, RNA transcript amplification, and GeneChip microarrays.Methods Mol Biol. 2005;293:187-207. doi: 10.1385/1-59259-853-6:187. Methods Mol Biol. 2005. PMID: 16028420 Review.
Cited by
-
Do-it-yourself: construction of a custom cDNA macroarray platform with high sensitivity and linear range.BMC Biotechnol. 2011 Oct 25;11:97. doi: 10.1186/1472-6750-11-97. BMC Biotechnol. 2011. PMID: 22026914 Free PMC article.
-
Embryonic gene expression among pollutant resistant and sensitive Fundulus heteroclitus populations.Aquat Toxicol. 2010 Jul 1;98(3):221-229. doi: 10.1016/j.aquatox.2010.02.022. Epub 2010 Mar 10. Aquat Toxicol. 2010. PMID: 20363516 Free PMC article.
-
The effect of short-term hypoxic exposure on metabolic gene expression.J Exp Zool A Ecol Genet Physiol. 2012 Jan 1;317(1):9-23. doi: 10.1002/jez.717. Epub 2011 Oct 21. J Exp Zool A Ecol Genet Physiol. 2012. PMID: 22021243 Free PMC article.
-
Pharmacogenomics: A Genetic Approach to Drug Development and Therapy.Pharmaceuticals (Basel). 2024 Jul 13;17(7):940. doi: 10.3390/ph17070940. Pharmaceuticals (Basel). 2024. PMID: 39065790 Free PMC article. Review.
-
Recent Major Transcriptomics and Epitranscriptomics Contributions toward Personalized and Precision Medicine.J Pers Med. 2022 Feb 1;12(2):199. doi: 10.3390/jpm12020199. J Pers Med. 2022. PMID: 35207687 Free PMC article. Review.
References
-
- Oleksiak MF, Churchill GA, Crawford DL. Variation in gene expression within and among natural populations. Nature Genetics. 2002;32:261–266. - PubMed
-
- de Koning DJ, Haley CS. Genetical genomics in humans and model organisms. Trends in Genetics. 2005;21:377–381. - PubMed
-
- Townsend JP, Cavalieri D, Hartl DL. Population genetic variation in genome-wide gene expression. Molecular Biology and Evolution. 2003;20:955–963. - PubMed
-
- Schadt EE, Monks SA, Drake TA, Lusis AJ, Che N, et al. Genetics of gene expression surveyed in maize, mouse and man. Nature. 2003;422:297–302. - PubMed
Publication types
MeSH terms
Substances
Grants and funding
LinkOut - more resources
Full Text Sources
Molecular Biology Databases
