. 2009;4(2):e4490.
doi: 10.1371/journal.pone.0004490. Epub 2009 Feb 16.

Short-term starvation of immune deficient Drosophila improves survival to gram-negative bacterial infections

Affiliations

Short-term starvation of immune deficient Drosophila improves survival to gram-negative bacterial infections

Anthony E Brown et al. PLoS One. 2009.

Abstract

Background: Primary immunodeficiencies are inborn errors of immunity that lead to life threatening conditions. These predispositions describe human immunity in natura and highlight the important function of components of the Toll-IL-1- receptor-nuclear factor kappa B (TIR-NF-kappaB) pathway. Since the TIR-NF-kappaB circuit is a conserved component of the host defence in higher animals, genetically tractable models may contribute ideas for clinical interventions.

Methodology/principal findings: We used immunodeficient fruit flies (Drosophila melanogaster) to address questions pertaining to survival following bacterial infection. We describe here that flies lacking the NF-kappaB protein Relish, indispensable for countering Gram-negative bacteria, had a greatly improved survival to such infections when subject to dietary short-term starvation (STS) prior to immune challenge. STS induced the release of Nitric Oxide (NO), a potent molecule against pathogens in flies, mice and humans. Administering the NO Synthase-inhibitory arginine analog N-Nitro-L-Arginine-Methyl-Ester (L-NAME) but not its inactive enantiomer D-NAME increased once again sensitivity to infection to levels expected for relish mutants. Surprisingly, NO signalling required the NF-kappaB protein Dif, usually needed for responses against Gram-positive bacteria.

Conclusions/significance: Our results show that NO release through STS may reflect an evolutionary conserved process. Moreover, STS could be explored to address immune phenotypes related to infection and may offer ways to boost natural immunity.


Conflict of interest statement

Competing Interests: The authors have declared that no competing interests exist.

Figures

Figure 1
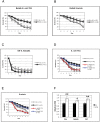
Figure 1. STS enhances Drosophila survival after septic injury.
(A) Seven-day survival curve of fed (AL; grey) or 24 hour starved rel flies (STS; black line) after infection with E. coli. Graphs show mean survival (±standard error [s.e.]) from four independent experiments. (B) Seven-day survival curve of STS rel (black line) or AL rel flies (grey line) after infection with Erwinia carotovora. Graphs show mean survival (±s.e.) from four independent experiments. (C) Seven-day survival of AL dif (grey line) or STS dif flies (black line) after infection with Enterococcus faecalis. Graphs show mean survival (±s.e.) from four independent experiments. (D) Seven-day survival of STS rel flies infected with E. coli. Newly eclosed flies had either been fed on media supplemented with the NOS inhibitor L-NAME (red line) or its inactive analogue D-NAME (blue line) for 48 hours before the STS regimen was enforced. In either case flies were returned to the L- or D-NAME vial after STS and infection. Graphs show mean survival (±s.e.) from four independent experiments (E) seven-day survival of STS rel flies infected with Erwinia carotovora. Newly eclosed flies had either been fed on media supplemented with the NOS inhibitor L-NAME (red line) or its inactive enantiomer D-NAME (blue line) for 48 hours before the STS regime was enforced. In either case flies were returned to the L- or D-NAME vial after STS and infection. Graphs show mean survival (±s.e.) of approximately 20 flies from four independent experiments. (F) Quantification of cellular nitric oxide in wild-type (Wn), rel, or dif flies having had free access to nutrients (AL; black bar) or after STS (white bar). In each case mean STS nitric oxide levels are normalised to the level in AL flies (of 1). Graphs show mean relative NO concentration of 15 male flies from four independent experiments (±s.e.). Asterisk indicates significance value of the result as determined by Student's t-Test (*P = <0.05, **P = <0.01).
Figure 2
Figure 2. STS results in containment of bacterial proliferation.
(A) Mean bacterial density per fly of rel flies infected with E. coli after being subject to AL (grey line) or STS (black line) feeding regimens. Data show mean colony forming units (c.f.u.) per fly (±s.e.) from four independent experiments. (B) Mean bacterial load of rel flies infected with Erwinia after AL (grey line) or STS (black line) feeding regimens. Data show mean c.f.u. per fly (±s.e.) from four independent experiments. (C) Mean bacterial load of STS rel flies infected with E. coli and cultured on media supplemented with the NOS inhibitor L-NAME (black line) or its inactive enantiomer D-NAME (grey line). Data show mean c.f.u. per fly (±s.e.) from four independent experiments.
Figure 3
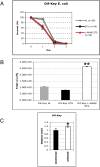
Figure 3. Enhanced survival after STS is dependent upon NF-κB signaling.
(A) Survival curve of E. coli-infected dif-key flies after AL (grey line), STS (black line) or STS and L-NAME-treatment (red line). Graphs show mean survival (±s.e.) from three independent experiments. (B) Total mean bacterial density of dif-key flies after infection with E. coli after AL (grey bars), STS (black bars) or treatment with L-NAME and STS (white bars). The total mean c.f.u. per fly (±s.e.) from three individual experiments are shown. Double asterisk (**) indicates a statistically significant difference in value from all other values (Student's t-Test; P = <0.01). (C) Quantification of cellular nitric oxide in E. coli-infected dif-key flies (white bars). Graphs show relative NO concentration (to uninfected flies [black bars]) of 15 male flies from three independent experiments (±s.e.). Asterisk (*) indicates statistically significant difference in the mean value in comparison to the other mean values presented in the graph as determined by Student's t-Test (P = <0.05).
Figure 4
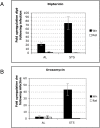
Figure 4. Antimicrobial peptide expression in flies subject to STS.
Diptericin (A) and Drosomycin (B) expression in AL or STS wild-type (Wn; black bars) and rel flies (white bars) after infection with E. coli. Data from three independent experiments show the fold change (±s.e.) in AMP expression after E. coli infection, normalised to the internal reference gene Rp49.
Figure 5
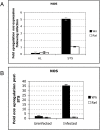
Figure 5. NOS is upregulated by STS and infection.
(A) Fold-change in NOS expression in AL or STS wild-type (black bars) or rel (white bars) flies following E. coli infection. (B) Fold-change in NOS expression in uninfected or E. coli-infected STS wild-type (black bars) or rel (white bars) flies. In all cases mean expression levels (±s.e.) from three independent experiments are shown.
Figure 6
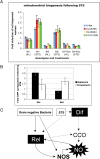
Figure 6. STS induces mitochondrial biogenesis.
(A) Fold change in the expression of genes used as markers for mitochondrial biogenesis following STS compared to AL conditions. Measurements by real-time quantitative PCR were corrected with rp49 expression as in [26]. The genes used were tfam, master regulator of mitochondrial biogenesis; CG13096 and CG10664, cox4; CG17280, cox6A. Note that the induction observed was dependent on NF-κB since it was not observed when both Toll-Dif and the Imd-Relish pathway were deficient (Dif-Key) (B) AMP gene expression is induced upon starvation. Fold-change in Diptericin (black bars) or Drosomycin (white bars) expression in wild type (Wn) or rel flies following STS. Induction of AMPs implies that NF-κB signalling is robustly activated following STS. In all cases in (A) and (B) mean expression levels (±s.e.) from three independent experiments are shown. (C) Putative mode of regulation of NO expression in Drosophila. NO is synthesised via overlapping and interconnected pathways. The main component of this mode is achieved through the direct upregulation of NOS mediated by the NF-κB protein Relish after infection by Gram-negative bacteria. NO can then upregulate the IMD pathway in a positive feedback loop. A second (minor) component of this would be the direct (NF-κB-independent) production of NO as an antimicrobial agent against Gram-negative bacteria. Finally, STS-mediated NO expression is catalysed by two-independent means. Principally through the up-regulation of Relish, leading to NOS upregulation as described above, or secondly, in a NOS-independent fashion. In this case starvation-induced NF-κB (either Relish and/or Dif) upregulation leads to CCO upregulation and NOS-independent NO production.

References

    1. Casanova JL, Abel L. Primary immunodeficiencies: a field in its infancy. Science. 2007;317:617–619. - PubMed
    1. Picard C, et al. Pyogenic bacterial infections in humans with IRAK-4 deficiency. Science. 2003;299:2076–2079. - PubMed
    1. Zhang, et al. TLR3 deficiency in patients with herpes simplex encephalitis. Science. 2007;317:1522–1527. - PubMed
    1. Akira S, Uematsu S, Takeuchi O. Pathogen recognition in innate immunity. Cell. 2006;124:783–801. - PubMed
    1. Wang L, Ligoxygakis P. Pathogen sensing and signalling in Drosophila immune response. Immunobiol. 2006;211:251–261. - PubMed

Publication types

MeSH terms

LinkOut - more resources