

Correcting for multivariate measurement error by regression calibration in meta-analyses of epidemiological studies
- PMID: 19222086
- PMCID: PMC2930206
- DOI: 10.1002/sim.3530
Correcting for multivariate measurement error by regression calibration in meta-analyses of epidemiological studies
Abstract
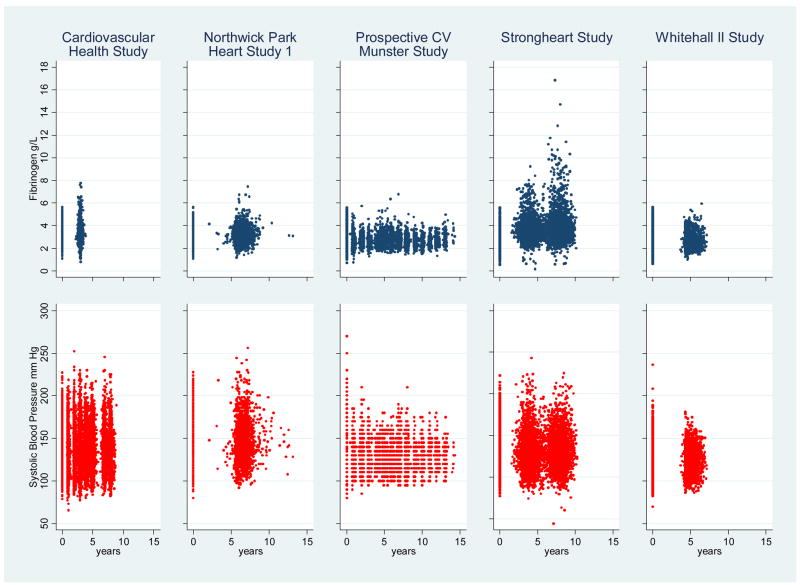
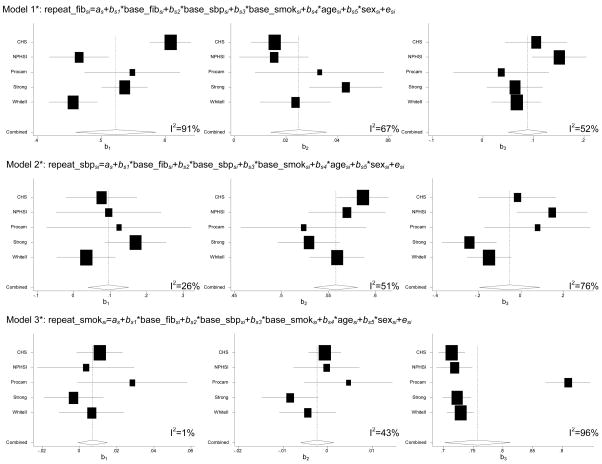
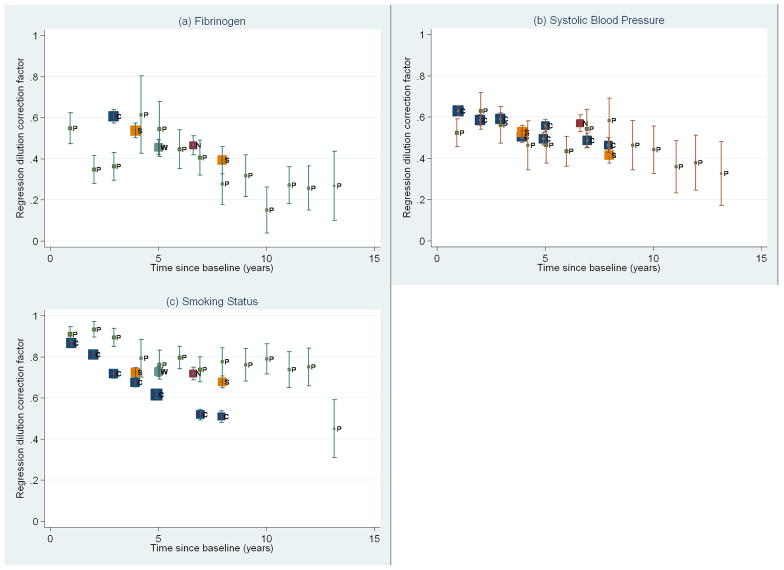
Within-person variability in measured values of multiple risk factors can bias their associations with disease. The multivariate regression calibration (RC) approach can correct for such measurement error and has been applied to studies in which true values or independent repeat measurements of the risk factors are observed on a subsample. We extend the multivariate RC techniques to a meta-analysis framework where multiple studies provide independent repeat measurements and information on disease outcome. We consider the cases where some or all studies have repeat measurements, and compare study-specific, averaged and empirical Bayes estimates of RC parameters. Additionally, we allow for binary covariates (e.g. smoking status) and for uncertainty and time trends in the measurement error corrections. Our methods are illustrated using a subset of individual participant data from prospective long-term studies in the Fibrinogen Studies Collaboration to assess the relationship between usual levels of plasma fibrinogen and the risk of coronary heart disease, allowing for measurement error in plasma fibrinogen and several confounders.
Copyright (c) 2009 John Wiley & Sons, Ltd.
Figures
References
-
- Carroll RJ, Ruppert D, Stefanski LA. Measurement Error in Nonlinear Models. London: Chapman and Hall; 1995.
-
- Prospective Studies Collaboration. Age-specific relevance of usual blood pressure to vascular mortality: a meta-analysis of individual data for one million adults in 61 prospective studies. Lancet. 2002;360:1903–1913. - PubMed
-
- MacMahon S, Peto R, Cutler J, Collins R, Sorlie P, Neaton J, Abbott R, Godwin J, Dyer A, Stamler J. Blood pressure, stroke, and coronary heart disease. Part 1, Prolonged differences in blood pressure: prospective observational studies corrected for the regression dilution bias. Lancet. 1990;335:765–74. - PubMed
-
- Phillips AN, Davey Smith G. How independent are independent effects?: relative risk estimation when correlated exposures are measured imprecisely. J Clin Epidemiol. 1991;44:1223–31. - PubMed
Publication types
MeSH terms
Substances
Grants and funding
LinkOut - more resources
Full Text Sources