. 2009 May;109(3):733-43.
doi: 10.1111/j.1471-4159.2009.05990.x. Epub 2009 Feb 13.

Casein kinase II contributes to the synergistic effects of BMP7 and BDNF on Smad 1/5/8 phosphorylation in septal neurons under hypoglycemic stress

Affiliations

Casein kinase II contributes to the synergistic effects of BMP7 and BDNF on Smad 1/5/8 phosphorylation in septal neurons under hypoglycemic stress

Florence Chaverneff et al. J Neurochem. 2009 May.

Abstract

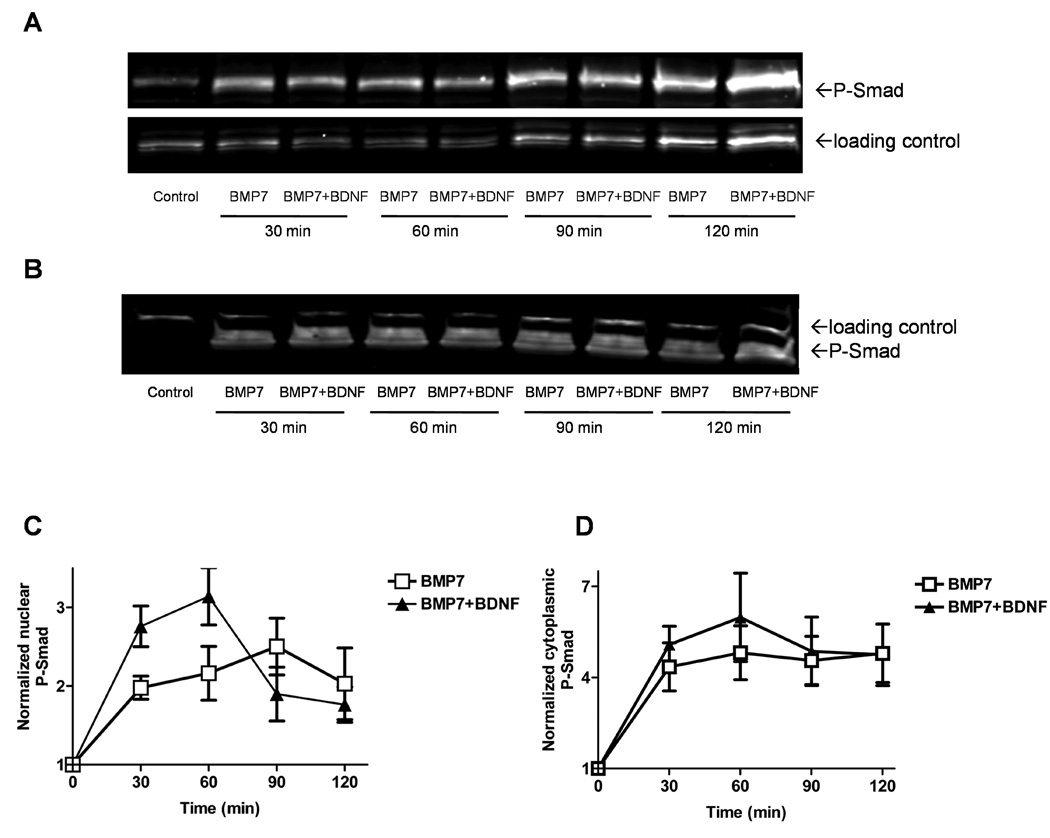
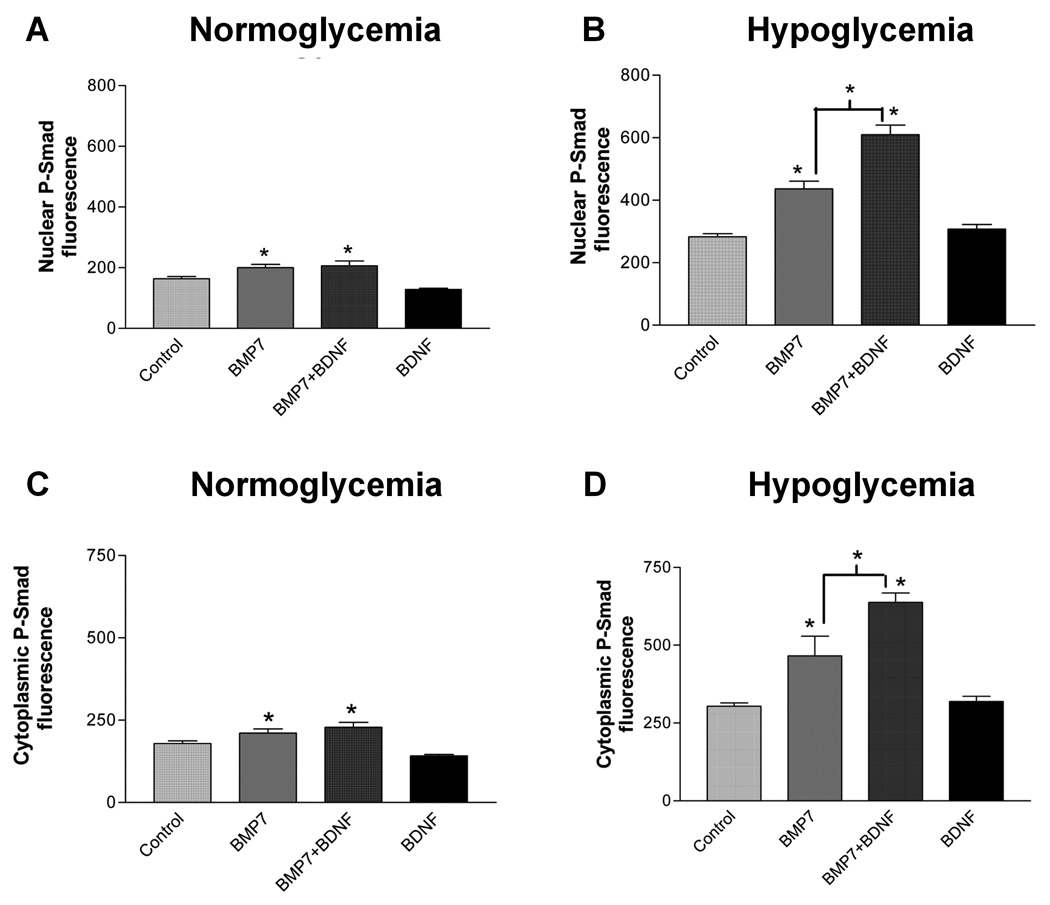
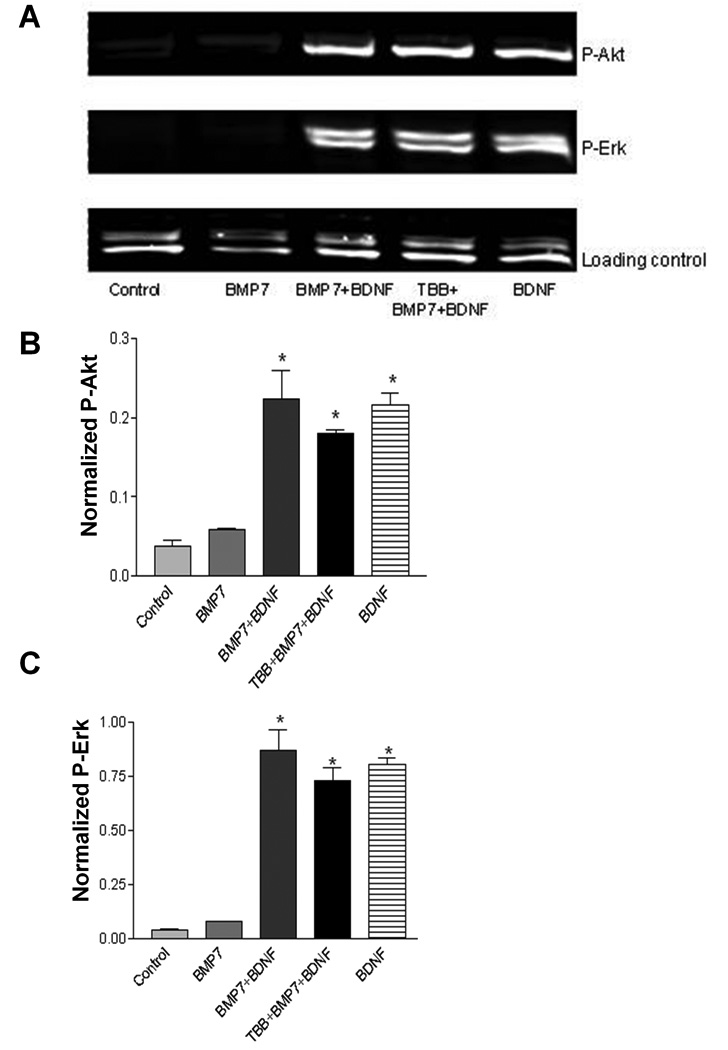
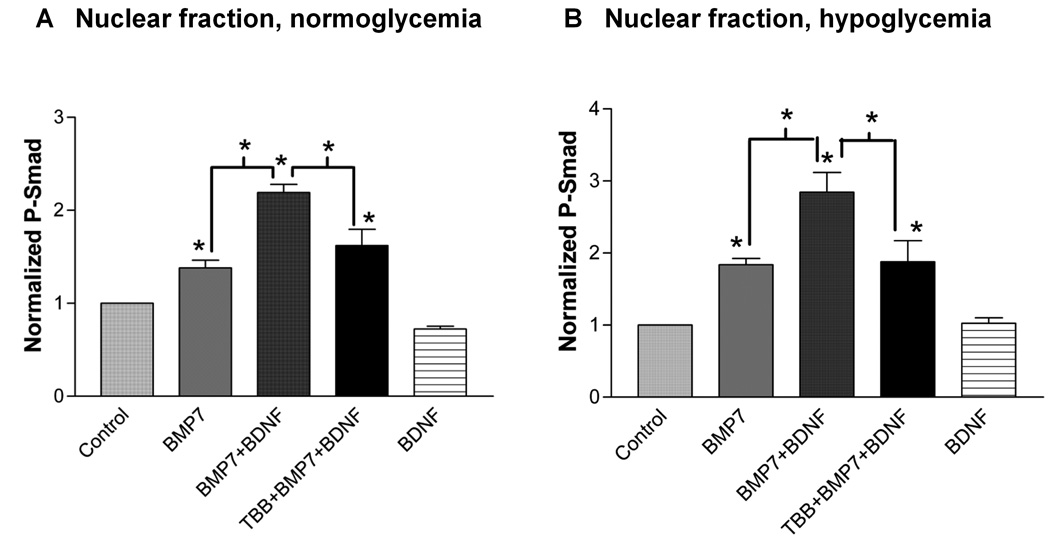
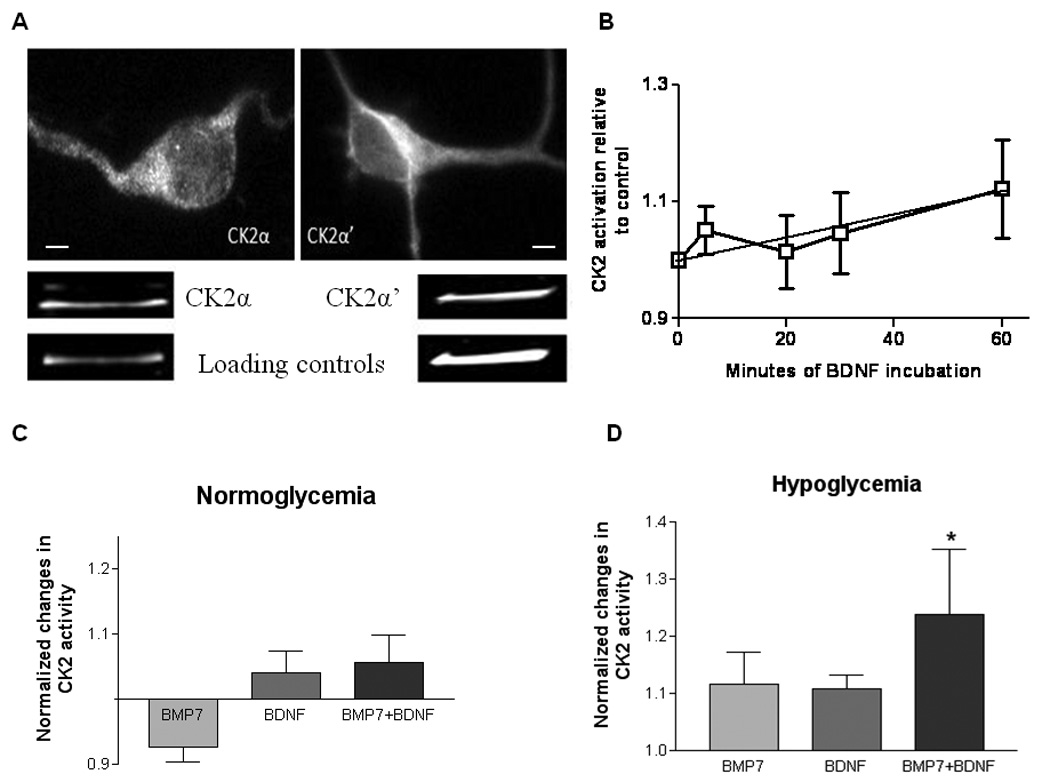
The combination of bone morphogenetic protein 7 (BMP7) and neurotrophins (e.g. brain-derived neurotrophic factor, BDNF) protects septal neurons during hypoglycemic stress. We investigated the signaling mechanisms underlying this synergistic protection. BMP7 (5 nM) increased phosphorylation and nuclear translocation of BMP-responsive Smads 1/5/8 within 30 min in cultures of rat embryonic septal neurons. BDNF (100 ng/mL) enhanced the BMP7-induced increase in phospho-Smad levels in both nucleus and cytoplasm; this effect was more pronounced after a hypoglycemic stress. BDNF increased both Akt and Erk phosphorylation, but pharmacological blockade of these kinase pathways (with wortmannin and U0126, respectively) did not reduce the Smad phosphorylation produced by the BMP7 + BDNF combination. Inhibitors of casein kinase II (CK2) activity reduced the (BMP7 + BDNF)-induced Smad phosphorylation, and this trophic factor combination increased CK2 activity in hypoglycemic cultures. These findings suggest that BDNF can increase BMP-dependent Smad phosphorylation via a mechanism requiring CK2.


Figures

Fig. 1
Fig. 1. BMP6/7 and a BMP-neurotrophin combination increase nuclear and cytoplasmic P-Smad levels
Septal cells at 5 days in vitro were treated for 1 h with BMP6/7 alone or in combination with BDNF+NGF, then stained with an anti-P-Smad 1/5/8 antibody and counterstained with DAPI. Average values of nuclear and cytoplasmic fluorescence were measured as detailed in Fig. 1 of Supporting Information. A) Log scale scatter plot of P-Smad fluorescence in the nucleus (y axis) and cytoplasm (x axis). Each point represents one neuron. Points situated above the 45° identity line represent cells in which nuclear fluorescence exceeded cytoplasmic fluorescence. B) Ratio of nuclear to cytoplasmic P-Smad fluorescence, a measure of nuclear translocation. * indicates significant difference from control or between the indicated trophic factor groups, assessed with one-way ANOVA followed by Newman-Keuls test (p<0.05, n≥22 cells per group, from two different experiments).
Fig. 2
Fig. 2. Time course of Smad 1/5/8 phosphorylation following addition of BMP7 ± BDNF
Western blots of nuclear (A) and cytoplasmic (B) fractions from lysates of cells grown for 5 to 7 days in culture after the indicated incubation periods with BMP7 or BMP7 plus BDNF. Loading controls for the cytoplasmic and nuclear compartments were poly (ADP-ribose) polymerase and TATA box binding protein, respectively. C, D) Quantification of nuclear (C) and cytoplasmic (D) blots like those shown in A and B. Averaged band intensities for P-Smad were normalized to their respective loading controls and this ratio was normalized to that of controls not exposed to trophic factors (plotted at 0 min). Regression analysis with Spearman non-parametric correlation showed that BMP7+BDNF increased nuclear P-Smad more than BMP7 alone during the first 60 min of incubation (data from ≥ 4 different experiments, p<0.01).
Fig. 3
Fig. 3. Hypoglycemia increases the enhancement of nuclear and cytoplasmic P-Smad levels produced by both BMP7 alone and a BMP7 + BDNF combination
Cultures grown for 5 days in vitro were subjected to hypoglycemic stress (B, D) or to serum-free medium with normal glucose (A, C). During the last hour, BMP7 alone, BDNF alone, or BMP7 + BDNF were added, and nuclear (A, B) and cytoplasmic (C, D) P-Smad fluorescence were measured, as in Fig. 1. * indicates significant increase from control or indicated group with p<0.01, using one-way ANOVA followed by Newman-Keuls test; each group represents measurements of P-Smad fluorescence in at least 25 cells.
Fig. 4
Fig. 4. BDNF-induced increases in phosphorylated Akt and Erk are not modified by BMP7 or a CK2 inhibitor, TBB
A) Western blot of cell lysates exposed for 15 min to BMP7, BDNF, or their combination. One experimental group was pretreated for 1 h with 20 µM TBB prior to trophic factor addition. B and C) Quantification of blots for P-Akt (B) and P-Erk (C), normalized to the loading control (TATA box binding protein, TBP). * indicates significant difference from control (p<0.001), one-way ANOVA followed by Dunnett’s test.
Fig. 5
Fig. 5. The increase in nuclear Smad fluorescence produced by (BMP7 + BDNF) is not reduced by inhibitors of PI3K/Akt, Mek/Erk, or Ca2+-dependent signaling (A), but is reduced by a CK2 inhibitor (B)
Cells under hypoglycemic conditions were pre-treated with pharmacological inhibitors for 1 h prior to and during a 1 h incubation with the indicated trophic factors. Nuclear P-Smad fluorescence was measured immunocytochemically, as described for Fig. 1. Wortmannin (Wort, 100 nM), Akt inhibitor (5 µM), U0126 (10 µM), BAPTA-AM (25 µM), TBB (20 µM). * indicates significant difference from control or indicated group, one-way ANOVA followed by Newman-Keuls test (p<0.001, n=6 to 54 cells).
Fig. 6
Fig. 6. A CK2 inhibitor reduces the (BMP7 + BDNF)-induced increase in P-Smad under both normoglycemic (A) and hypoglycemic (B) conditions
Nuclear fractions prepared from lysates were exposed to the indicated trophic factor(s) for 1 h, with some cultures also exposed to TBB for 1 h prior to and during trophic factor exposure. P-Smad fluorescence from Western blots was normalized to both non-treated control and loading control (TBP). * indicates significant difference from control or indicated group, one-way ANOVA followed by Newman-Keuls test (p<0.05, n=4 experiments).
Fig. 7
Fig. 7. Localization of catalytic subunits of CK2 in septal neurons and activation of CK2 by BDNF and BMP7
A) Immunocytochemical staining (top) and immunoblotting (bottom) for CK2α and CK2α’. Loading markers were neurofilament 200 for CK2α and TBP for CK2α’. Both assays were performed under normoglycemic conditions with no added trophic factors; there was no obvious change in subcellular localization during hypoglycemia, whether in the presence or absence of trophic factors. B) CK2 activity assayed after different durations of exposure to BDNF. Linear regression analysis of values averaged from 5 experiments (normalized to untreated controls) showed a significant increase over 60 min of BDNF incubation (r=0.53, p<0.01). C, D) Effects of a 1 h exposure to BMP7, BDNF or a BMP7+BDNF combination on CK2 activity, measured under normoglycemic (C) and hypoglycemic (D, 3 h) conditions. Experimental values were corrected by subtracting values measured in the absence of cell lysates, then normalized to values measured in the absence of trophic factors. The activity of control lysates was ~5.4×10⁻⁶ pmol/µg protein/min. CK2 inhibitors (TBB and TBBz) inhibited this control activity by 78% and 89%, respectively (not shown). *significant difference from control, one-way ANOVA followed by Dunnett’s test (p<0.05, n=10 experiments). None of the other differences or intergroup comparisons was significant. Calibration bars in A: 2 µm

Similar articles

Cited by

References

    1. Althini S, Usoskin D, Kylberg A, Kaplan PL, Ebendal T. Blocked MAP kinase activity selectively enhances neurotrophic growth responses. Mol. Cell. Neurosci. 2004;25(2):345–354. - PubMed
    1. Angley C, Kumar M, Dinsio KJ, Hall AK, Siegel RE. Signaling by bone morphogenetic proteins and Smad1 modulates the postnatal differentiation of cerebellar cells. J. Neurosci. 2003;23(1):260–268. - PMC - PubMed
    1. Arevalo MA, Rodriguez-Tebar A. Activation of casein kinase II and inhibition of phosphatase and tensin homologue deleted on chromosome 10 phosphatase by nerve growth factor/p75NTR inhibit glycogen synthase kinase-3beta and stimulate axonal growth. Mol. Biol. Cell. 2006;17(8):3369–3377. - PMC - PubMed
    1. Atwal JK, Massie B, Miller FD, Kaplan DR. The TrkB-Shc site signals neuronal survival and local axon growth via MEK and P13-kinase. Neuron. 2000;27(2):265–277. - PubMed
    1. Bengtsson H, Soderstrom S, Kylberg A, Charette MF, Ebendal T. Potentiating interactions between morphogenetic protein and neurotrophic factors in developing neurons. J. Neurosci. Res. 1998;53(5):559–568. - PubMed

Publication types

MeSH terms