Comparative Study
. 2009 Apr;109(2):551-61.
doi: 10.1111/j.1471-4159.2009.05989.x. Epub 2009 Feb 13.

In vitro glutaminase regulation and mechanisms of glutamate generation in HIV-1-infected macrophage

Affiliations
Comparative Study

In vitro glutaminase regulation and mechanisms of glutamate generation in HIV-1-infected macrophage

Nathan Erdmann et al. J Neurochem. 2009 Apr.

Abstract

Mononuclear phagocyte (MP, macrophages and microglia) dysfunction plays a significant role in the pathogenesis of HIV-1-associated dementia (HAD) through the production and release of soluble neurotoxic factors including glutamate. Glutamate production is greatly increased following HIV-1 infection of cultured MP, a process dependent upon the glutamate-generating enzyme glutaminase. Glutaminase inhibition was previously found to significantly decrease macrophage-mediated neurotoxicity. Potential mechanisms of glutaminase-mediated excitotoxicity including enzyme up-regulation, increased enzyme activity and glutaminase localization were investigated in this report. RNA and protein analysis of HIV-infected human primary macrophage revealed up-regulation of the glutaminase isoform GAC, yet identified no changes in the kidney-type glutaminase isoform over the course of infection. Glutaminase is a mitochondrial protein, but was found to be released into the cytosol and extracellular space following infection. This released enzyme is capable of rapidly converting the abundant extracellular amino acid glutamine into excitotoxic levels of glutamate in an energetically favorable process. These findings support glutaminase as a potential component of the HAD pathogenic process and identify a possible therapeutic avenue for the treatment of neuroinflammatory states such as HAD.


Figures

Figure 1
Figure 1. Glutaminase isoform regulation identified by microarray analysis
Panel A, Human MDM were infected with HIV-1ADA for 5 days before total RNA was collected. mRNA from duplicate HIV-1ADA-infected and uninfected MDM was used to generate tagged cDNA, which was hybridized to an Affymetrix GeneChip HG-U133A Array. Hybridization intensities for each probe set (gene) were analyzed by means of MAS 5.0 to calculate a single numerical gene expression. Panel B, representation of KGA and GAC mRNA transcripts. Both genes are encoded at the same locus, mRNA is processed yielding two distinct gene products. KGA protein is encoded by exons 1-14 and 16-19. GAC is encoded by exons 1-15 and consequently has a unique C-terminus. The functional region of glutaminase enzyme is shared by both gene products.
Figure 2
Figure 2. Real-time RT-PCR of glutaminase during course of HIV infection
MDM were infected with HIV-1ADA for 1, 3, 5, 7 and 9 days before total RNA was collected. A, Supernatants were tested for reverse transcriptase activity. B-C, Real-time probes specific to KGA glutaminase (B) or GAC glutaminase (C) were applied to determine expression levels as compared to the internal control GAPDH. D-E, MDM were infected with HIV-1ADA, HIV-1JR-FL, or HIV-189.6, culture supernatants and RNA were collected 7 days after infection and reverse transcriptase activity (D) and GAC expression (E) were determined. Results are expressed as average ± SD of triplicate samples and are representative of 3 independent experiments with MDM from at least 3 different donors. * denotes p < 0.01 in comparison to control. In panel F, cells were infected with HIV-1ADA with or without AZT (5 μm) treatment for 7 days. GAC expression was determined by real-time RT-PCR. * denotes p < 0.01 in comparison to control, # denotes p < 0.05 as compared to HIV infection alone.
Figure 3
Figure 3. Western blotting of glutaminase during course of HIV-1 infection
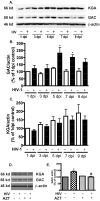
Human MDM were grown in culture and then infected with HIV-1ADA for 1, 3, 5, 7, or 9 days. A, Whole cell lysates were collected and analyzed by Western blot for glutaminase (KGA and GAC). β-actin was used as a loading control. B-C, Levels of GAC (B) and KGA (C) were normalized as a ratio to β-actin after densimetrical quantification and shown as percentage of control (1 dpi). Open bars represent control MDM and solid bars represent HIV-1-infected MDM. D-E, MDM were infected with HIV-1ADA for 7 days with or without AZT treatment (5 μM). Whole-cell lysates were collected and analyzed by Western blotting for GAC (D). GAC Bands were quantified and expressed as percentage of control (E). Quantification results were shown as average ± SEM in experiments performed with 4 different donors. *, p < 0.05 compared with day-matched control. # indicates p < 0.05 when compared to HIV group.
Figure 4
Figure 4. siRNA treatment targeting GAC in infected human macrophage
Human MDM were grown in culture and infected with HIV-1ADA. Infected MDM were then transfected with siRNA targeting glutaminase or non-specific control. A.) Whole cell lysates were collected and analyzed by Western blotting for glutaminase (KGA and GAC). β-actin was used as a loading control. B-C, Levels of GAC (B) and KGA (C) were normalized as a ratio to β-actin after densimetrical quantification and shown as percentage of control. Quantification results were shown as average ± SEM in experiments performed with 4 different donors. * denotes p < 0.05 compared with control MDM. ## indicates p < 0.01 when compared to HIV group. D.) Supernatants were analyzed by RP-HPLC for glutamate concentration. Results are expressed as average ± SEM of 2 independent experiments with MDM from 2 different donors. ** denotes p < 0.01 compared with control or non-specific siRNA control. ## indicates p < 0.01 when compared to HIV or non-specific siRNA-transfected HIV group.
Figure 5
Figure 5. HIV-1-mediated glutamate production enhanced by cytotoxicity
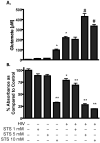
Human MDM were infected with HIV-1ADA for 7 days and then incubated in serum-free neurobasal medium with 5 mM glutamine. Control and HIV-infected MDM were treated with staurosporine (1, 5, or 10 mM). The concentration of glutamate in cell-free supernatants was determined by RP-HPLC (A). All data are expressed as the absolute concentration of glutamate (µM). * denotes p < 0.01 in comparison to control. # denotes p < 0.01 as compared to HIV infection alone. Cell viability was assessed by MTT assay (B). Results are expressed as average ± SD of triplicate samples and are representative of 3 different donors. * denotes p < 0.01 in comparison to control, ** denotes p< 0.001.
Figure 6
Figure 6. Glutaminase release from rat brain mitochondria
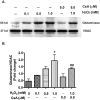
Rat brain mitochondria were isolated and stimulated ex vivo with H2O2 (0.1, 0.5, or 1 mM) with or without cyclosporine A (5 μM) treatment. A, Mitochondrial supernatants were collected and analyzed via Western blotting for glutaminase and the mitochondrial loading control VDAC. B, Levels of glutaminase were normalized as a ratio to VDAC after densimetrical quantification and shown as fold change to control. Results are expressed as average ± SEM of 2 independent experiments with rat brain mitochondria from 2 different donors. * denotes p < 0.05 compared with control. ## indicates p < 0.01 when compared to HIV group.
Figure 7
Figure 7. Glutaminase release from human MDM mitochondria in vitro
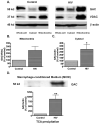
Human MDM were infected with HIV-1ADA for seven days in culture. (A) Cells were collected and separated into mitochondrial and cytosolic fractions. Fractions were analyzed by Western blotting for GAC, VDAC and β-actin. VDAC and β-actin were used as loading controls for mitochondrial and cytosolic fractions, respectively. B-C, Levels of GAC in mitochondria (B) and cytosol (C) were normalized as a ratio to VDAC or β-actin after densimetrical quantification and shown as percentage of control. In panel D, Protein from equal volumes (30 ml) of conditioned-medium from cultures control or HIV-infected MDM were precipitated using TCA. GAC levels in the precipitated protein were determined by Western blotting. Results are representative of 3 different donors. Quantification results were shown as average ± SEM in experiments performed with MDM from 4 different donors. *denotes p < 0.05 compared with control. ** indicates p < 0.01 compared with control.

References

    1. Anderson ER, Gendelman HE, Xiong H. Memantine protects hippocampal neuronal function in murine human immunodeficiency virus type 1 encephalitis. J Neurosci. 2004;24:7194–7198. - PMC - PubMed
    1. Baglietto-Vargas D, Lopez-Tellez JF, Moreno-Gonzalez I, Gutierrez A, Aledo JC. Segregation of two glutaminase isoforms in islets of Langerhans. Biochem J. 2004;381:483–487. - PMC - PubMed
    1. Belmadani A, Zou J, Schipma MJ, Neafsey EJ, Collins MA. Ethanol pre-exposure suppresses HIV-1 glycoprotein 120-induced neuronal degeneration by abrogating endogenous glutamate/Ca(2+)-mediated neurotoxicity. Neuroscience. 2001;104:769–781. - PubMed
    1. Chen HS, Lipton SA. The chemical biology of clinically tolerated NMDA receptor antagonists. J Neurochem. 2006;97:1611–1626. - PubMed
    1. Choi DW. Glutamate neurotoxicity and diseases of the nervous system. Neuron. 1988;1:623–634. - PubMed

Publication types

MeSH terms