. 2009 Feb 17:10:5.
doi: 10.1186/1471-2091-10-5.

Transmembrane voltage regulates binding of annexin V and lactadherin to cells with exposed phosphatidylserine

Affiliations

Transmembrane voltage regulates binding of annexin V and lactadherin to cells with exposed phosphatidylserine

Christina Smith et al. BMC Biochem. .

Abstract

Background: Cells expose phosphatidylserine during apoptosis. The voltage across the plasma membrane also decreases or disappears during apoptosis, but the physiological significance of this is unknown.

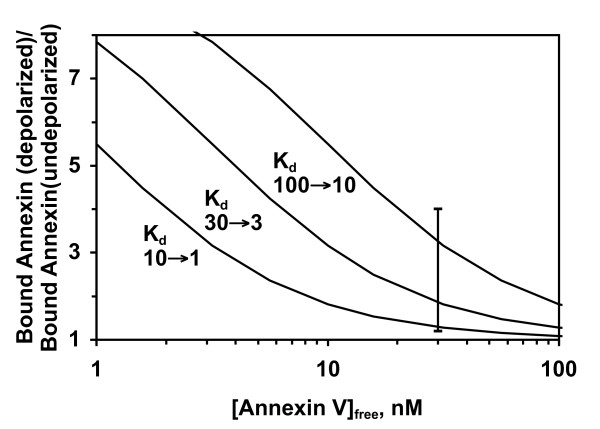
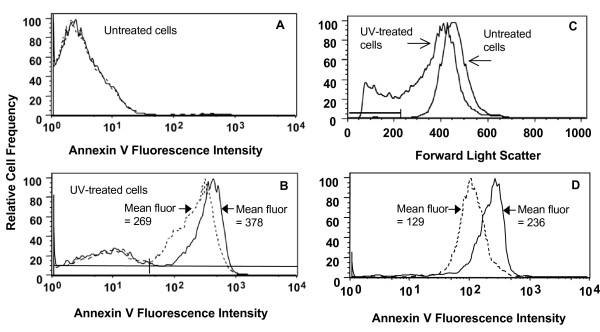
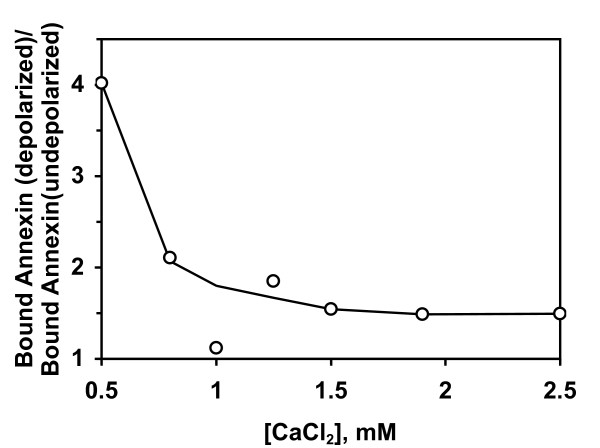
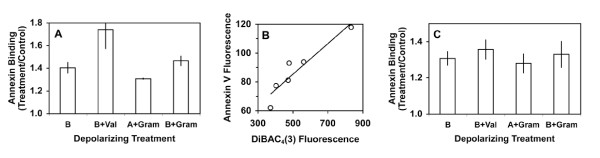
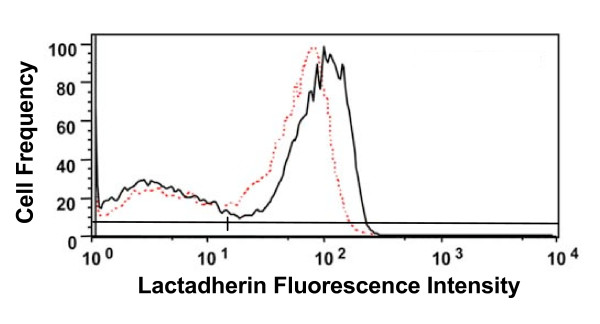
Results: Here we show that transmembrane potential regulates membrane binding of two unrelated proteins that recognize exposed phosphatidylserine on apoptotic cells. In Jurkat T leukemia cells and K562 promyelocytic leukemia cells undergoing apoptosis, extracellular binding of annexin V was increased by decreasing membrane potential in a dose-dependent manner. Studies with phospholipid vesicles showed that the effect was mediated via an increase in binding affinity. The effect was independent of the apoptotic stimulus. The same phenomenon occurred with lactadherin, a structurally unrelated protein that also binds to apoptotic cells via phosphatidylserine and is essential for in vivo clearance of dying cells.

Conclusion: Alterations in membrane potential regulate the binding of annexin V and lactadherin to cell membranes, and may also influence the membrane binding of other classes of phosphatidylserine-binding proteins.


Figures

Figure 1
Figure 1
Theoretical calculation of how increased binding affinity due to depolarization could increase annexin V binding under different conditions of affinity and ligand concentration. Five theoretical binding isotherms were calculated for Kd values of 1, 3, 10, 30, and 100 nM from the Langmuir isotherm (bound fraction = [annexin V]/([annexin V] + Kd)). These curves were then used to calculate the effect of a ten-fold increase in binding affinity (ΔpKd of +1) on the relative amount of annexin V bound to a cell for three different situations: Kd changes from 10 nM to 1 nM (left curve); 30 to 3 nM (middle curve); 100 to 10 nM (right curve). The Kd range from 1 to 100 nM was chosen for illustration because experimental apparent Kd values for annexin V binding to cells are in this general range [19-21]. The vertical bar indicates the experimentally observed range of depolarized/undepolarized binding ratios under the various experimental conditions used in this study (see subsequent figures).
Figure 2
Figure 2
Depolarization increases binding of annexin V to cells with exposed PS. Jurkat cells were left untreated (Panel A) or were exposed to UV light to induce apoptosis (Panel B). After 3.5 h, cells were assayed by flow cytometry with fluorescein-annexin V-117. Most of the UV-treated cells have entered the apoptotic pathway and have exposed PS on the extracellular face of the plasma membrane, as indicated by the development of a sizable population of annexin-positive cells. Depolarization with high-potassium Buffer B (solid lines) increases the mean fluorescence intensity of annexin-positive cells about 41% compared to results obtained in low-potassium Buffer A (dashed lines). However, depolarization does not alter the mean fluorescence of the annexin-negative population in either untreated or UV-treated cells. The horizontal bars in the lower part of Panel B indicate the gates used to define the annexin-negative and annexin-positive cell populations to allow calculation of mean fluorescence intensities for these cell populations. Panel C: Forward-scatter histograms for untreated cells or UV-treated cells. The horizontal line indicates the gate used to define the shrunken cells that are observed only in apoptosis. Panel D: Annexin V histograms for the shrunken apoptotic cells assayed in low-potassium A buffer (dashed lines) or high-potassium B buffer (solid lines). Depolarization increases annexin V binding to this population by about 83%.
Figure 3
Figure 3
Depolarization causes larger relative increases in annexin V binding at lower calcium concentrations. Jurkat cells were treated with UV light, then assayed by flow cytometry 3.5 h later. Cells were assayed with Alexa-680-annexin V-117 in either Buffer A or Buffer B with the indicated concentration of calcium chloride. The subpopulation of small apoptotic cells was selected with a forward-scatter gate as shown in Figure 2C, and the mean annexin V fluorescence of this population was calculated. The graph shows the ratio of mean annexin V fluorescence in depolarizing buffer to mean annexin V fluorescence in non-depolarizing buffer at each calcium concentration.
Figure 4
Figure 4
Effect of depolarizing agents on annexin V binding to apoptotic Jurkat and K562 cells. Panel A: Jurkat cells were treated with UV light; 3.5 h later, cells were assayed in one of the following buffers: buffer A; buffer B; buffer A + 1 μM gramicidin; buffer B + 1 μM gramicidin; buffer B + 1 μM valinomycin. Results are expressed as the mean fluorescence of the annexin-positive cells for each treatment relative to the mean fluorescence of cells assayed in non-depolarizing A buffer. Results are mean ± SEM for two to nine independent experiments for each treatment; all treatment/control ratios are significantly different from 1.0 by two-tailed t test (p < 0.02). Panel B: Correlation between increased annexin V binding and degree of depolarization as measured with the membrane-potential-sensitive dye DiBAC4(3). Jurkat cells treated as described in Panel A were assayed by two-color flow cytometry with DiBAC4(3) and AlexaFluor680-annexin V-117. DiBAC4(3) uptake increases as membrane potential becomes less negative. Panel C: K562 cells were treated with UV light and then assayed as described in Panel A. Results are mean ± SEM of two to four independent experiments; all treatment/control ratios are significantly different from 1.0 by two-tailed t test (p < 0.02).
Figure 5
Figure 5
Depolarization increases the binding of lactadherin to apoptotic cells. Jurkat cells were prepared as described in the legend to Figure 2, and were then assayed with fluorescein-lactadherin in low-potassium A buffer (dashed lines) or depolarizing high-potassium B buffer (solid line). Assay in B buffer increased the mean fluorescence of the lactadherin-positive cell population by an average of 33 ± 2% compared to cells assayed in A buffer (mean ± SEM of three separate experiments). Horizontal lines indicate the gates used to define lactadherin-negative and lactadherin-positive cells.

Similar articles

Cited by

References

    1. Hengartner MO. The biochemistry of apoptosis. Nature. 2000;407:770–6. doi: 10.1038/35037710. - DOI - PubMed
    1. Balasubramanian K, Schroit AJ. Aminophospholipid asymmetry: A matter of life and death. Annu Rev Physiol. 2003;65:701–34. doi: 10.1146/annurev.physiol.65.092101.142459. - DOI - PubMed
    1. Arur S, Uche UE, Rezaul K, Fong M, Scranton V, Cowan AE, Mohler W, Han DK. Annexin I is an endogenous ligand that mediates apoptotic cell engulfment. Dev Cell. 2003;4:587–98. doi: 10.1016/S1534-5807(03)00090-X. - DOI - PubMed
    1. Fan X, Krahling S, Smith D, Williamson P, Schlegel RA. Macrophage surface expression of annexins I and II in the phagocytosis of apoptotic lymphocytes. Mol Biol Cell. 2004;15:2863–72. doi: 10.1091/mbc.E03-09-0670. - DOI - PMC - PubMed
    1. Hanayama R, Tanaka M, Miwa K, Shinohara A, Iwamatsu A, Nagata S. Identification of a factor that links apoptotic cells to phagocytes. Nature. 2002;417:182–7. doi: 10.1038/417182a. - DOI - PubMed

Publication types

MeSH terms

LinkOut - more resources