

Mining EEG-fMRI using independent component analysis
- PMID: 19223007
- PMCID: PMC2693483
- DOI: 10.1016/j.ijpsycho.2008.12.018
Mining EEG-fMRI using independent component analysis
Abstract
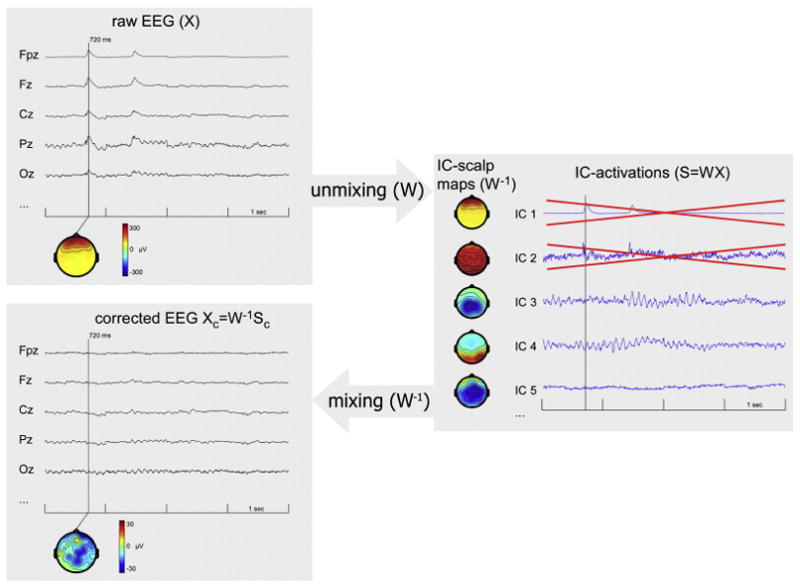
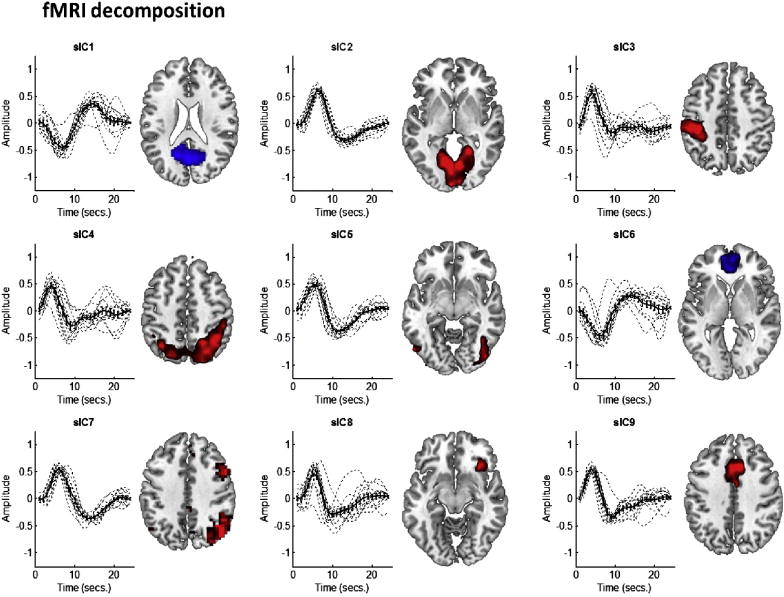
Independent component analysis (ICA) is a multivariate approach that has become increasingly popular for analyzing brain imaging data. In contrast to the widely used general linear model (GLM) that requires the user to parameterize the brain's response to stimuli, ICA allows the researcher to explore the factors that constitute the data and alleviates the need for explicit spatial and temporal priors about the responses. In this paper, we introduce ICA for hemodynamic (fMRI) and electrophysiological (EEG) data processing, and one of the possible extensions to the population level that is available for both data types. We then selectively review some work employing ICA for the decomposition of EEG and fMRI data to facilitate the integration of the two modalities to provide an overview of what is available and for which purposes ICA has been used. An optimized method for symmetric EEG-fMRI decomposition is proposed and the outstanding challenges in multimodal integration are discussed.
Figures


Similar articles
-
A review of group ICA for fMRI data and ICA for joint inference of imaging, genetic, and ERP data.Neuroimage. 2009 Mar;45(1 Suppl):S163-72. doi: 10.1016/j.neuroimage.2008.10.057. Epub 2008 Nov 13. Neuroimage. 2009. PMID: 19059344 Free PMC article. Review.
-
Independent component analysis (ICA) of generalized spike wave discharges in fMRI: comparison with general linear model-based EEG-fMRI.Hum Brain Mapp. 2011 Feb;32(2):209-17. doi: 10.1002/hbm.21010. Hum Brain Mapp. 2011. PMID: 20336659 Free PMC article.
-
Recursive approach of EEG-segment-based principal component analysis substantially reduces cryogenic pump artifacts in simultaneous EEG-fMRI data.Neuroimage. 2015 Jan 1;104:437-51. doi: 10.1016/j.neuroimage.2014.09.049. Epub 2014 Oct 2. Neuroimage. 2015. PMID: 25284302
-
A Comparison of Independent Component Analysis (ICA) of fMRI and Electrical Source Imaging (ESI) in Focal Epilepsy Reveals Misclassification Using a Classifier.Brain Topogr. 2015 Nov;28(6):813-31. doi: 10.1007/s10548-015-0436-4. Epub 2015 May 22. Brain Topogr. 2015. PMID: 25998855
-
Integration of multimodal neuroimaging methods: a rationale for clinical applications of simultaneous EEG-fMRI.Funct Neurol. 2015 Jan-Mar;30(1):9-20. Funct Neurol. 2015. PMID: 26214023 Free PMC article. Review.
Cited by
-
Modern Methods for Interrogating the Human Connectome.J Int Neuropsychol Soc. 2016 Feb;22(2):105-19. doi: 10.1017/S1355617716000060. J Int Neuropsychol Soc. 2016. PMID: 26888611 Free PMC article. Review.
-
Dynamic EEG-informed fMRI modeling of the pain matrix using 20-ms root mean square segments.Hum Brain Mapp. 2010 Nov;31(11):1702-12. doi: 10.1002/hbm.20967. Hum Brain Mapp. 2010. PMID: 20162596 Free PMC article.
-
Non-negative matrix factorization of multimodal MRI, fMRI and phenotypic data reveals differential changes in default mode subnetworks in ADHD.Neuroimage. 2014 Nov 15;102 Pt 1:207-19. doi: 10.1016/j.neuroimage.2013.12.015. Epub 2013 Dec 19. Neuroimage. 2014. PMID: 24361664 Free PMC article. Review.
-
Multimodal functional network connectivity: an EEG-fMRI fusion in network space.PLoS One. 2011;6(9):e24642. doi: 10.1371/journal.pone.0024642. Epub 2011 Sep 22. PLoS One. 2011. PMID: 21961040 Free PMC article.
-
Multi-timescale hybrid components of the functional brain connectome: A bimodal EEG-fMRI decomposition.Netw Neurosci. 2020 Jul 1;4(3):658-677. doi: 10.1162/netn_a_00135. eCollection 2020. Netw Neurosci. 2020. PMID: 32885120 Free PMC article.
References
-
- Aguirre GK, Zarahn E, D’Esposito M. The variability of human, BOLD hemodynamic responses. Neuroimage. 1998;8:360–369. - PubMed
-
- Allen PJ, Josephs O, Turner R. A method for removing imaging artifact from continuous EEG recorded during functional MRI. Neuroimage. 2000;12:230–239. - PubMed
-
- Allen PJ, Polizzi G, Krakow K, Fish DR, Lemieux L. Identification of EEG events in the MR scanner: the problem of pulse artifact and a method for its subtraction. Neuroimage. 1998;8:229–239. - PubMed
-
- Amaro E, Jr, Barker GJ. Study design in fMRI: basic principles. Brain Cogn. 2006;60:220–232. - PubMed
-
- Andrade A, Paradis AL, Rouquette S, Poline JB. Ambiguous results in functional neuroimaging data analysis due to covariate correlation. Neuroimage. 1999;10:483–486. - PubMed
Publication types
MeSH terms
Substances
Grants and funding
LinkOut - more resources
Full Text Sources
Medical
Miscellaneous
