A genetic screen for components of the mammalian RNA interference pathway in Bloom-deficient mouse embryonic stem cells
- PMID: 19223321
- PMCID: PMC2651804
- DOI: 10.1093/nar/gkp019
A genetic screen for components of the mammalian RNA interference pathway in Bloom-deficient mouse embryonic stem cells
Abstract
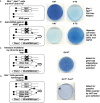
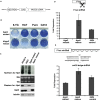
Genetic screens performed in model organisms have helped identify key components of the RNA interference (RNAi) pathway. Recessive genetic screens have recently become feasible through the use of mouse embryonic stem (ES) cells that are Bloom's syndrome protein (Blm) deficient. Here, we developed and performed a recessive genetic screen to identify components of the mammalian RNAi pathway in Blm-deficient ES cells. Genome-wide mutagenesis using a retroviral gene trap strategy resulted in the isolation of putative homozygous RNAi mutant cells. Candidate clones were confirmed by an independent RNAi-based reporter assay and the causative gene trap integration site was identified using molecular techniques. Our screen identified multiple mutant cell lines of Argonaute 2 (Ago2), a known essential component of the RNAi pathway. This result demonstrates that true RNAi components can be isolated by this screening strategy. Furthermore, Ago2 homozygous mutant ES cells provide a null genetic background to perform mutational analyses of the Ago2 protein. Using genetic rescue, we resolve an important controversy regarding the role of two phenylalanine residues in Ago2 activity.
Figures


Similar articles
-
A Recessive Genetic Screen for Components of the RNA Interference Pathway Performed in Mouse Embryonic Stem Cells.Methods Mol Biol. 2017;1622:111-129. doi: 10.1007/978-1-4939-7108-4_9. Methods Mol Biol. 2017. PMID: 28674805
-
A recessive genetic screen for components of the RNA interference pathway in mouse embryonic stem cells.Methods Mol Biol. 2010;650:45-63. doi: 10.1007/978-1-60761-769-3_4. Methods Mol Biol. 2010. PMID: 20686942
-
Mismatch repair genes identified using genetic screens in Blm-deficient embryonic stem cells.Nature. 2004 Jun 24;429(6994):891-5. doi: 10.1038/nature02653. Nature. 2004. PMID: 15215866
-
Bloom syndrome and the underlying causes of genetic instability.Mol Genet Metab. 2021 May;133(1):35-48. doi: 10.1016/j.ymgme.2021.03.003. Epub 2021 Mar 10. Mol Genet Metab. 2021. PMID: 33736941 Review.
-
From RNAi screens to molecular function in embryonic stem cells.Stem Cell Rev Rep. 2012 Mar;8(1):32-42. doi: 10.1007/s12015-011-9269-z. Stem Cell Rev Rep. 2012. PMID: 21526416 Free PMC article. Review.
Cited by
-
Isolation of homozygous mutant mouse embryonic stem cells using a dual selection system.Nucleic Acids Res. 2012 Feb;40(3):e21. doi: 10.1093/nar/gkr908. Epub 2011 Nov 29. Nucleic Acids Res. 2012. PMID: 22127858 Free PMC article.
-
Screening for stress-resistance mutations in the mouse.Front Genet. 2014 Sep 8;5:310. doi: 10.3389/fgene.2014.00310. eCollection 2014. Front Genet. 2014. PMID: 25250048 Free PMC article.
-
Derivation and characterization of haploid embryonic stem cell cultures in medaka fish.Nat Protoc. 2010 Aug;5(8):1418-30. doi: 10.1038/nprot.2010.104. Epub 2010 Jul 15. Nat Protoc. 2010. PMID: 20671725
-
Mobile elements in the human genome: implications for disease.Genome Med. 2012 Feb 24;4(2):12. doi: 10.1186/gm311. Genome Med. 2012. PMID: 22364178 Free PMC article.
-
Mammalian hyperplastic discs homolog EDD regulates miRNA-mediated gene silencing.Mol Cell. 2011 Jul 8;43(1):97-109. doi: 10.1016/j.molcel.2011.06.013. Mol Cell. 2011. PMID: 21726813 Free PMC article.
References
-
- Mello CC, Conte D., Jr. Revealing the world of RNA interference. Nature. 2004;431:338–342. - PubMed
-
- Hannon GJ. RNA interference. Nature. 2002;418:244–251. - PubMed
-
- Tomari Y, Zamore PD. Perspective: machines for RNAi. Genes Dev. 2005;19:517–529. - PubMed
-
- Sontheimer EJ. Assembly and function of RNA silencing complexes. Nat. Rev. Mol. Cell Biol. 2005;6:127–138. - PubMed
-
- Baulcombe D. RNA silencing. Trends Biochem. Sci. 2005;30:290–293. - PubMed
Publication types
MeSH terms
Substances
Grants and funding
LinkOut - more resources
Full Text Sources
Molecular Biology Databases

