. 2009 Apr;15(4):600-14.
doi: 10.1261/rna.1403509. Epub 2009 Feb 17.

mRNA stability changes precede changes in steady-state mRNA amounts during hyperosmotic stress

Affiliations

mRNA stability changes precede changes in steady-state mRNA amounts during hyperosmotic stress

Claes Molin et al. RNA. 2009 Apr.

Abstract

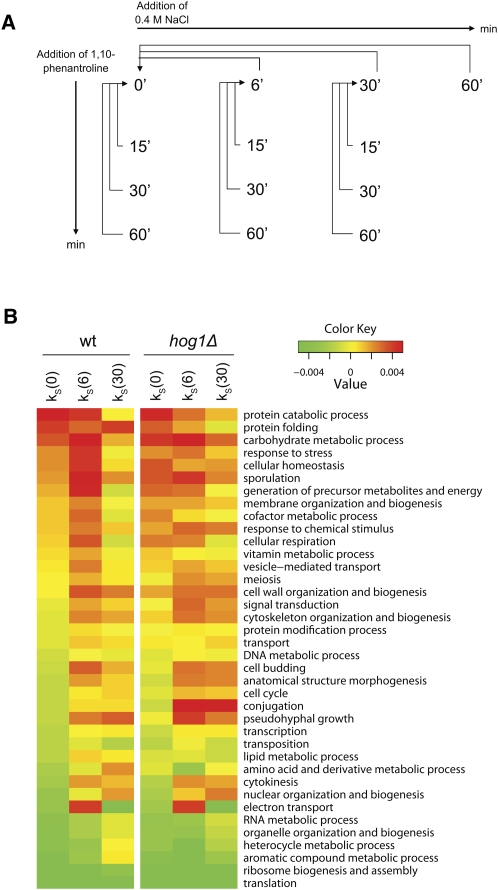
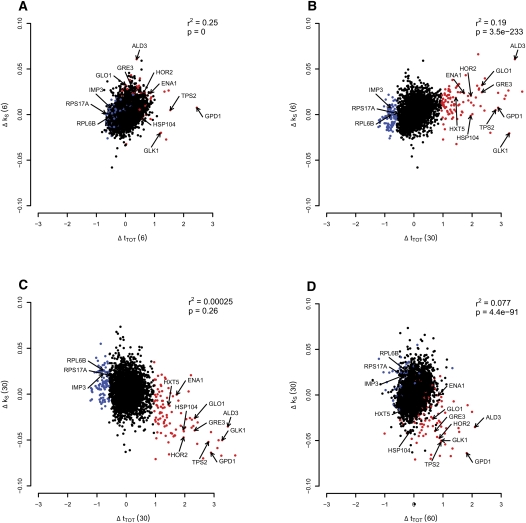
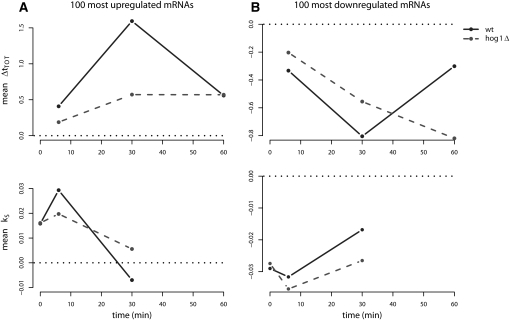
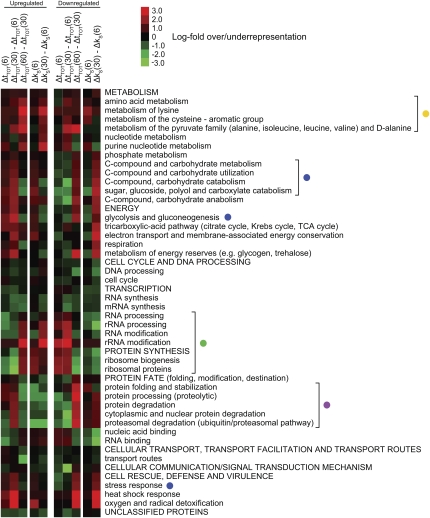
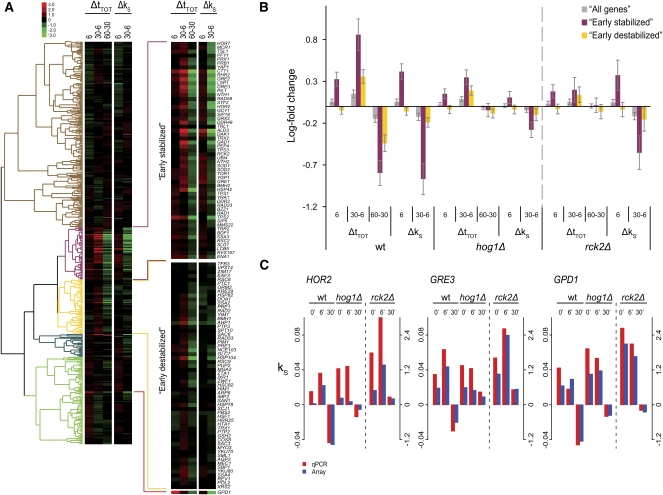
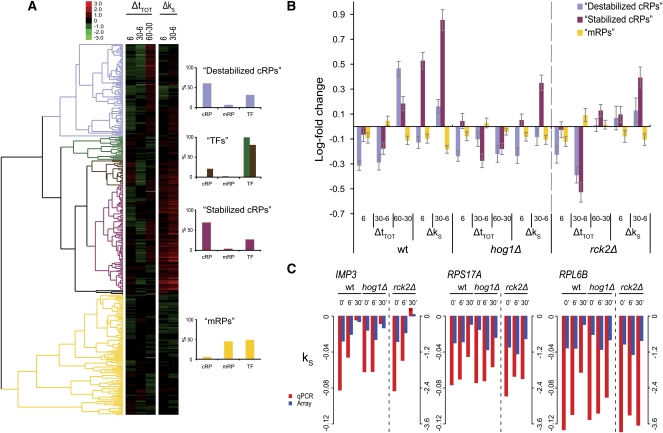
Under stress, cells need to optimize the activity of a wide range of gene products during the response phases: shock, adaptation, and recovery. This requires coordination of several levels of regulation, including turnover and translation efficiencies of mRNAs. Mitogen-activated protein (MAP) kinase pathways are implicated in many aspects of the environmental stress response, including initiation of transcription, translation efficiency, and mRNA turnover. In this study, we analyze mRNA turnover rates and mRNA steady-state levels at different time points following mild hyperosmotic shock in Saccharomyces cerevisiae cells. The regulation of mRNA stability is transient and affects most genes for which there is a change in transcript level. These changes precede and prepare for the changes in steady-state levels, both regarding the initial increase and the later decline of stress-induced mRNAs. The inverse is true for stress-repressed genes, which become stabilized during hyperosmotic stress in preparation of an increase as the cells recover. The MAP kinase Hog1 affects both steady-state levels and stability of stress-responsive transcripts, whereas the Hog1-activated kinase Rck2 influences steady-state levels without a major effect on stability. Regulation of mRNA stability is a wide-spread, but not universal, effect on stress-responsive transcripts during transient hyperosmotic stress. By destabilizing stress-induced mRNAs when their steady-state levels have reached a maximum, the cell prepares for the subsequent recovery phase when these transcripts are to return to normal levels. Conversely, stabilization of stress-repressed mRNAs permits their rapid accumulation in the recovery phase. Our results show that mRNA turnover is coordinated with transcriptional induction.


Figures

FIGURE 1.
FIGURE 1.
Several functional transcript categories are regulated at the stability level after salt stress. (A) Study design. Transcript steady-state levels were investigated at 6, 30, and 60 min after 0.4 M NaCl shock. Stability was investigated at the time points 0, 6, and 30 min by the addition of Phen. Aliquots were harvested at 15, 30, and 60 min after Phen addition to monitor mRNA decay and stability indices (k S) were calculated. (B) mRNA stability in functional categories before and after stress. All 38 GO Slim broad functional categories (biological process) were ranked from most (top) to least stable (bottom) based on the mean k S of unstressed wt cells (left-most column). Unstressed wt and hog1Δ cells have similar mean k S for most categories. After 6 min of stress, categories that are initially stable tend to get more stabilized in the wild type, while initially unstable categories are further destabilized. After 30 min, the reverse is true, as stabilized categories are destabilized and vice versa. In the hog1Δ mutant, both steps in this response at the stability level are less pronounced.
FIGURE 2.
FIGURE 2.
Transcript regulation at the stability level precedes the regulation at the steady-state level. Scatter plots of changes in mRNA stability (Δk S) versus changes in steady-state levels (Δt TOT) at various times after stress. The 100 most highly induced genes after 30 min at the steady-state level [Δt TOT (30)] are colored in red, and the 100 most down-regulated genes at the same time point are colored blue. Ten well-known stress-responsive genes and three down-regulated genes required for protein synthesis are indicated by arrows (including the six genes verified by qPCR: HOR2, GRE3, GPD1, IMP3, RPS17A, and RPL6B). The alterations in steady-state levels and mRNA stability correlate positively when comparing stability after 6 min [Δk S (6)] with steady-state levels after 6 min [Δt TOT (6)] (A), as well as with steady-state levels after 30 min [Δt TOT (30)] (B). The change in stability after 30 min [Δk S (30)] was not globally correlated with the difference in steady-state levels after 30 min [Δt TOT (30)] (C), but a group of outliers consisting of the most induced genes at the steady-state level (marked in red) show an inverse relationship, indicating that these salt-responsive genes are now destabilized. After 60 min of stress, the steady-state levels are lower for the salt-responsive genes (D). For information about the correlation test, see Materials and Methods.
FIGURE 3.
FIGURE 3.
Hog1 affects both steady-state levels and stability. Average stability index (k S) and steady-state log-fold changes (Δt TOT) of the 100 most up-regulated (A) and down-regulated (B) genes at the steady-state level at 30 min in the wild type against time in wt and hog1Δ cells. Zero on the y-axis is indicated by a reference line (dotted black). These groups of genes display a distinct temporal pattern where changes in stability precede changes at the steady-state level. Hog1 influences both the changes in stability and at the steady-state level for both groups. Two-sample t-tests were used to calculate P-values for the average differences between the strains in all panels (see Materials and Methods).
FIGURE 4.
FIGURE 4.
Functional categories have different temporal regulation profiles at the steady-state and the stability levels. Enrichment analysis (using hypergeometrical distribution) of functional categories on the 200 most up-regulated (left panel) and down-regulated (right panel) transcripts in the different phases of the response: the shock phase (0–6 min), the adaptation phase (6–30 min), and the recovery phase (30–60 min) in the wt. In each panel, the first three lanes show changes in steady-state levels, and the last two lanes show changes in stability. Only the categories significantly over- or underrepresented in any of the conditions (P-value < 0.01, Bonferroni corrected) were included in the plot. Red indicates overrepresentation and green indicates underrepresentation. Functional categories emphasized in the text are bracketed and marked with colored dots.
FIGURE 5.
FIGURE 5.
Cluster analysis of the GO Slim category Response to stress. (A) The genes in the GO Slim category response to stress were hierarchically clustered (uncentered Pearson correlation metric) with respect to the behavior of the transcripts in the wt during the phases of salt stress response. Genes with more than one missing value were omitted. To obtain value ranges comparable between steady state and stability, the stability indices were multiplied by 30 to approximate the log-fold differences 30 min after transcription inhibition (see Materials and Methods). The two clusters (“Early stabilized” and “Early destabilized,” shown magnified to the right) include genes responsive to 0.4 M NaCl stress. GPD1 fell outside the two clusters because of its fast up-regulation at the steady-state level. (B) Mean changes in steady-state and stability levels were calculated for the two clusters defined in (A) across the strains (wt, hog1Δ, and rck2Δ) shows that Hog1 influences both steady-state levels and stability, especially for the early stabilized cluster, while Rck2 mainly influences steady-state levels without major effects on stability. Error bars denote 95% confidence intervals. (C) Stability indices were confirmed by qPCR for three genes (HOR2, GRE3, and GPD1). HOR2 and GRE3 are part of the early-stabilized cluster, while GPD1 fell outside the clusters. Spearman rank correlation between array and qPCR data: 0.9 (see Materials and Methods).
FIGURE 6.
FIGURE 6.
Cluster analysis of the GO Slim functional category translation. (A) The genes in the GO Slim category Translation were hierarchically clustered according to transcript behavior in the wild type, and the Δk S values were multiplied by 30 as in Fig. 5 (genes with >1 missing value omitted). Five clusters were defined, highly enriched for cytoplasmic ribosomal proteins (cRPs), mitochondrial ribosomal proteins (mRPs), and translation factors (TFs), respectively, as shown in bar diagrams to the right. Note that the composition of clusters 2 and 3 are shown in the same diagram. (B) The mean log fold change at the steady-state and stability levels of the three RP-enriched clusters are plotted. The mean changes across the conditions were calculated for wt, hog1Δ, and rck2Δ cells. The mRPs cluster show only small changes during stress, while the cRPs are divided into two clusters, which differ in their regulation at the steady-state as well as the stability level. Especially the recuperation in the recovery phase is affected in both mutants to a similar extent. Error bars denote 95% confidence intervals. (C) The stability indices of two cRPs (RPS17A and RPL6B) were confirmed by qPCR, along with a gene in the RiBi group (IMP3). Spearman rank correlation between array and qPCR data: 0.9 (see Materials and Methods).

References

    1. Albertyn J., Hohmann S., Thevelein J.M., Prior B.A. GPD1, which encodes glycerol-3-phosphate dehydrogenase, is essential for growth under osmotic stress in Saccharomyces cerevisiae, and its expression is regulated by the high-osmolarity glycerol response pathway. Mol. Cell. Biol. 1994;14:4135–4144. - PMC - PubMed
    1. Arikawa E., Sun Y., Wang J., Zhou Q., Ning B., Dial S.L., Guo L., Yang J. Cross-platform comparison of SYBR Green real-time PCR with TaqMan PCR, microarrays and other gene expression measurement technologies evaluated in the MicroArray Quality Control (MAQC) study. BMC Genomics. 2008;9:328. doi: 10.1186/1471-2164-9-328. - DOI - PMC - PubMed
    1. Asp E., Nilsson D., Sunnerhagen P. Fission yeast mitogen-activated protein kinase Sty1 interacts with translation factors. Eukaryot. Cell. 2008;7:328–338. - PMC - PubMed
    1. Bilsland E., Molin C., Swaminathan S., Ramne A., Sunnerhagen P. Rck1 and Rck2 MAPKAP kinases and the HOG pathway are required for oxidative stress resistance. Mol. Microbiol. 2004;53:1743–1756. - PubMed
    1. Bilsland E., Hult M., Bell S.D., Sunnerhagen P., Downs J.A. The Bre5/Ubp3 ubiquitin protease complex from budding yeast contributes to the cellular response to DNA damage. DNA Repair (Amst.) 2007;6:1471–1484. - PubMed

Publication types

MeSH terms

Substances

LinkOut - more resources