. 2009 Mar 1;69(5):1712-6.
doi: 10.1158/0008-5472.CAN-08-3978. Epub 2009 Feb 17.

Introducing nanochemoprevention as a novel approach for cancer control: proof of principle with green tea polyphenol epigallocatechin-3-gallate

Affiliations

Introducing nanochemoprevention as a novel approach for cancer control: proof of principle with green tea polyphenol epigallocatechin-3-gallate

Imtiaz A Siddiqui et al. Cancer Res. .

Abstract

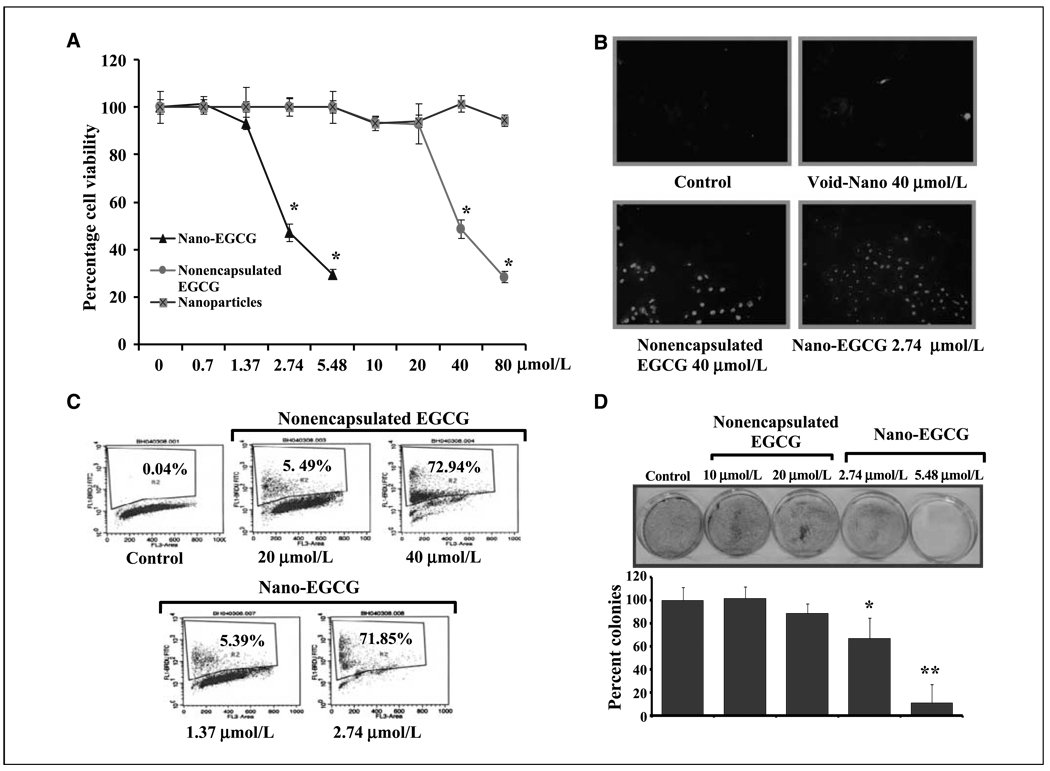
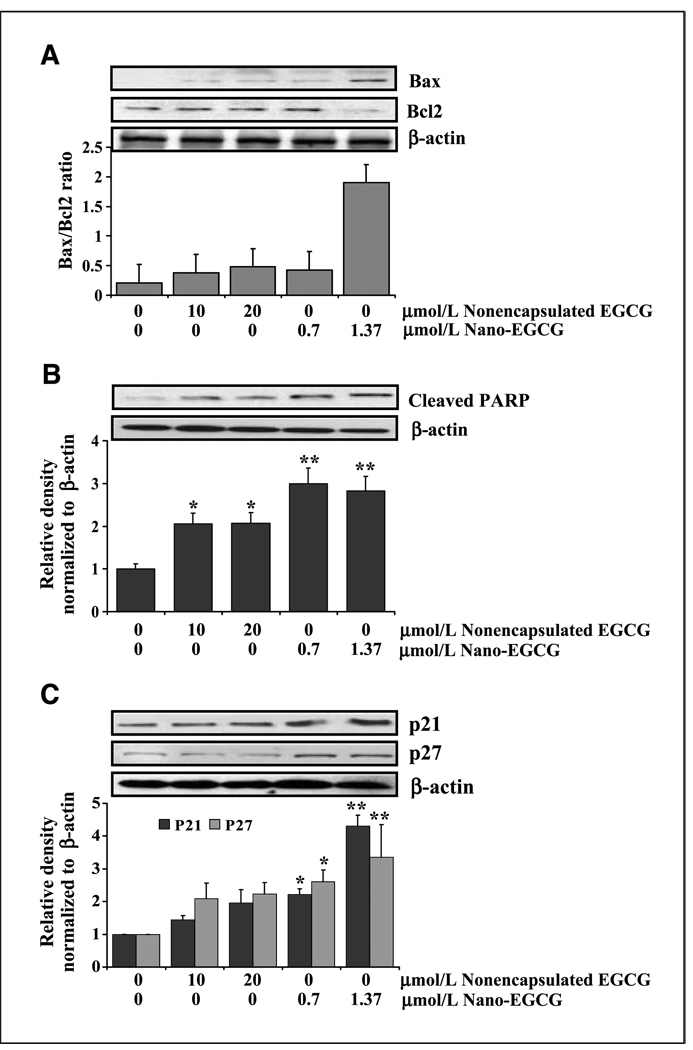
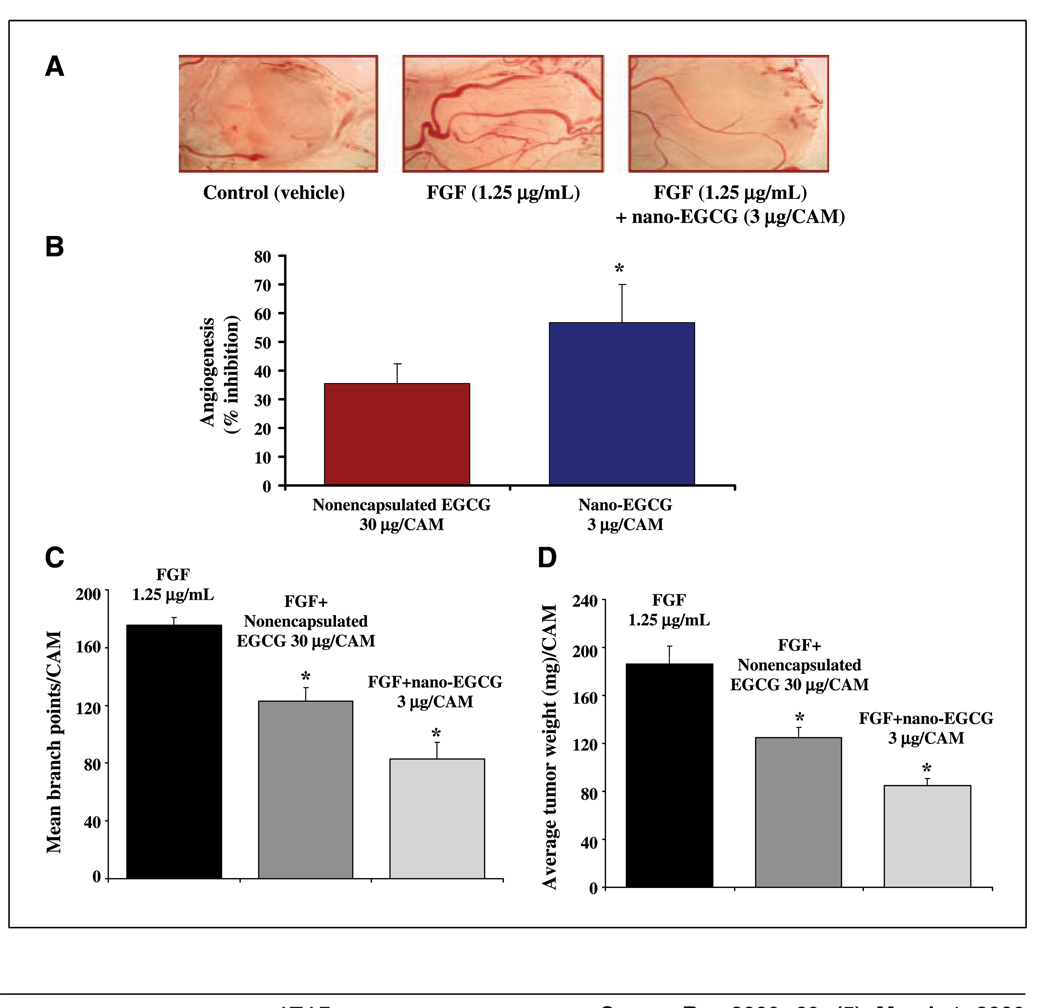
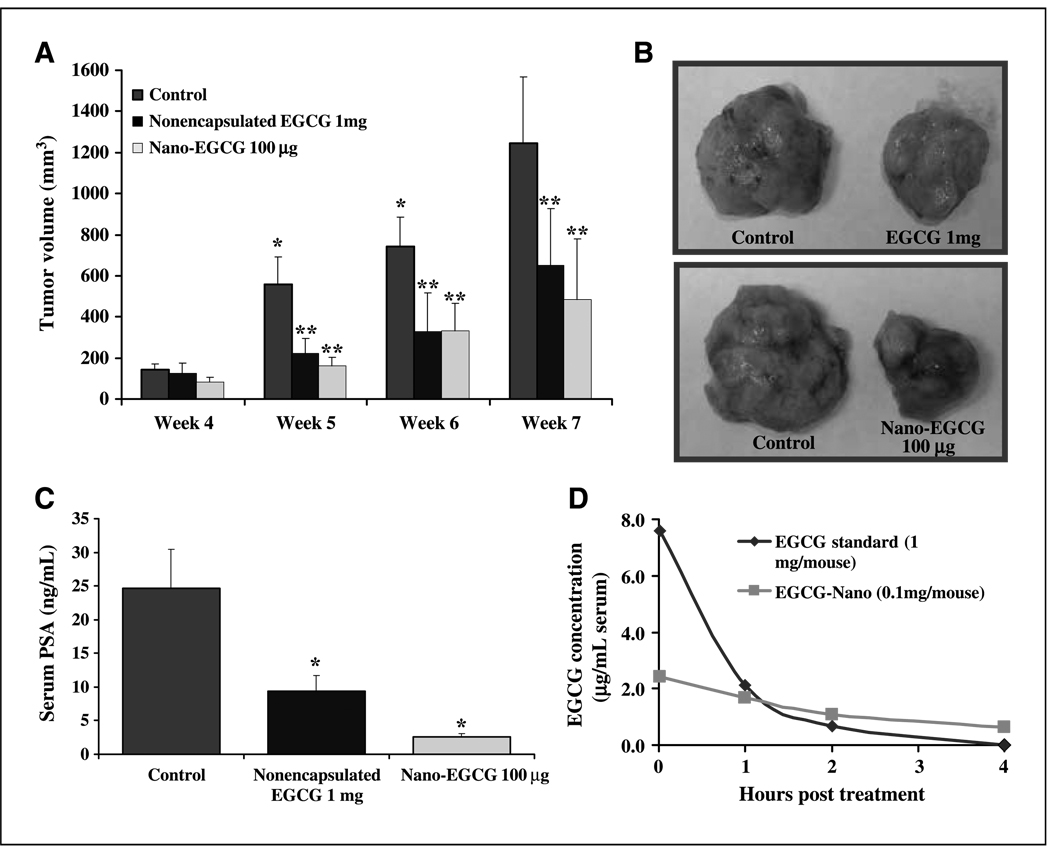
Chemoprevention, especially through the use of naturally occurring phytochemicals capable of impeding the process of one or more steps of carcinogenesis process, is a promising approach for cancer management. Despite promising results in preclinical settings, its applicability to humans has met with limited success largely due to inefficient systemic delivery and bioavailability of promising chemopreventive agents. Here, we introduce the concept of nanochemoprevention, which uses nanotechnology for enhancing the outcome of chemoprevention. We encapsulated green tea polyphenol epigallocatechin-3-gallate (EGCG) in polylactic acid-polyethylene glycol nanoparticles and observed that encapsulated EGCG retains its biological effectiveness with over 10-fold dose advantage for exerting its proapoptotic and angiogenesis inhibitory effects, critically important determinants of chemopreventive effects of EGCG in both in vitro and in vivo systems. Thus, this study could serve as a basis for the use of nanoparticle-mediated delivery to enhance bioavailability and limit any unwanted toxicity of chemopreventive agents, such as EGCG.


Conflict of interest statement

Disclosure of Potential Conflicts of Interest

No potential conflicts of interest were disclosed.

Figures

Figure 1
Figure 1
Comparative effects of nonencapsulated EGCG and nano-EGCG treatment on cell viability and apoptosis. A, cell growth analysis. PC3 cells were treated with EGCG, void nanoparticles, and nano-EGCG for 24 h, and cell growth was determined by MTT assay. Points, mean of three separate experiments wherein each treatment was repeated in 10 wells; bars, SE. *, P < 0.001 compared with the vehicle-treated controls. B, apoptosis detection. PC3 cells were grown on cell culture slides and treated with EGCG and nano-EGCG for 48 h. Apoptosis was determined, as detailed in Materials and Methods. Representative photomicrographs from each treatment group showing induction of apoptosis (green fluorescence). Data are from experiment repeated thrice with similar results. C, quantitative estimation of apoptosis. Cells were treated for 48 h and labeled with dUTP using an Apo-direct apoptosis kit. The values shown indicate the extent of apoptosis. The images are representative of three independent experiments with similar results. D, colony formation. PC3 cells were treated with each agent, and the plates were observed for colonies, counted, and plotted as a bar graph. Bars, SE. *, P < 0.05; **, P < 0.01 compared with the vehicle-treated controls. The results are from a representative experiment repeated thrice with similar results.
Figure 2
Figure 2
Comparative effects of nonencapsulated EGCG and nano-EGCG on apoptotic biomarkers. A, protein expression of Bax, Bcl2, and the Bax/Bcl2 ratio. B, protein expression of cleaved PARP. C, protein expression of p21 and p27. The cells were treated with each agent and harvested 24 h after treatments. Details of the experiments are described in Materials and Methods. Equal loading was confirmed by stripping the membrane and reprobing it with β-actin. Histograms represent relative densities of the bands normalized to β-actin. *, P < 0.05; **, P < 0.01 compared with the vehicle-treated controls. Each experiment was repeated thrice with similar results.
Figure 3
Figure 3
Comparative effects of nano-EGCG and nonencapsulated EGCG on FGF-induced angiogenesis. A, CAM assay. Photopictographs of a typical experiment showing the angiogenesis pattern in different treatments. Data are from a typical experiment repeated in five CAM with similar results. B, bar graph showing percentage inhibition of angiogenesis in nonencapsulated EGCG–treated and nano-EGCG–treated CAM. Columns, data of angiogenesis from experiment done with five CAM membranes with similar results; bars, SE. *, P < 0.05 compared with the EGCG-treated group. C, mean branch points. Mean branch points were counted per CAM. Columns, data for inhibition of mean branch points in CAM membranes from a typical experiment repeated in five CAM with similar results; bars, ±SE. *, P < 0.05 compared with the vehicle-treated controls. D, average tumor weight. CAM tumors were excised and weighed 5 d after cell grafting. Data are from a typical experiment repeated in five CAM with comparative results. *, P < 0.05 compared with the vehicle-treated controls.
Figure 4
Figure 4
Comparative effects of nonencapsulated EGCG and nano-EGCG on tumor growth and PSA secretion in a xenograft model. A, effect on the growth of tumor xenografts. Details of the experiments are given in Materials and Methods. Columns, tumor volume (mm3) of seven mice; bars, SE. *, P < 0.05 compared with the data from control group at previous time point. **, P < 0.01 compared with the control group at the respective time point. B, photographs of tumors. Photographs were taken of the excised tumors at the termination of the experiment. Typical tumors from control and treated groups. C, effect on the serum PSA levels. The levels of PSA were determined by ELISA assay and expressed as serum (in ng/mL) ± SE of five mice. *, P < 0.05 compared with the vehicle-treated controls. D, EGCG serum levels. Four mice in each group were treated with the agents and bled immediately and 1, 2, and 4 h after treatment. Serum was separated, and EGCG concentration was determined. Results are expressed as EGCG concentration (µg/mL serum).

Similar articles

Cited by

References

    1. Murray CJL, Lopez AD, editors. The global burden of disease: a comprehensive assessment of mortality and disability from diseases, injuries and risk factors in 1990 and projected to 2020. Cambridge, MA: Harvard University Press on behalf of the World Health Organization and the World Bank; 1996.
    1. Siddiqui IA, Afaq F, Adhami VM, Mukhtar H. Prevention of prostate cancer through custom tailoring of chemopreventive regimen. Chem Biol Interact. 2008;171:122–132. - PubMed
    1. Nishiyama N. Nanomedicine: nanocarriers shape up for long life. Nat Nanotechnol. 2007;2:203–204. - PubMed
    1. Jemal A, Siegel R, Ward E, et al. Cancer statistics, 2008. CA Cancer J Clin. 2008;58:71–96. - PubMed
    1. Khan N, Afaq F, Saleem M, Ahmad N, Mukhtar H. Targeting multiple signaling pathways by green tea polyphenol (−)-epigallocatechin-3-gallate. Cancer Res. 2006;66:2500–2505. - PubMed

Publication types