

Age-related changes in subtelomeric methylation in the normal Japanese population
- PMID: 19223605
- PMCID: PMC2657167
- DOI: 10.1093/gerona/gln057
Age-related changes in subtelomeric methylation in the normal Japanese population
Abstract
Background: The telomeres of somatic cells become shorter with individual aging. However, no significant change in subtelomeric methylation of somatic cells with aging has yet been reported.
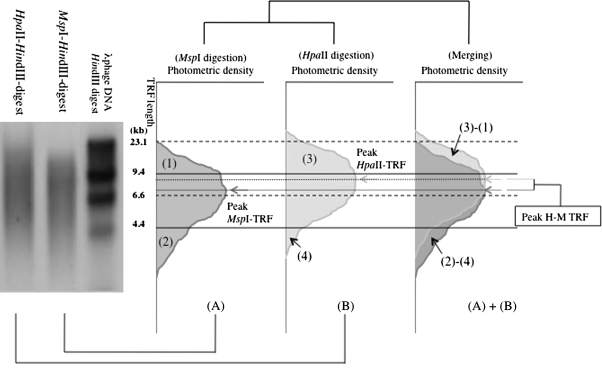
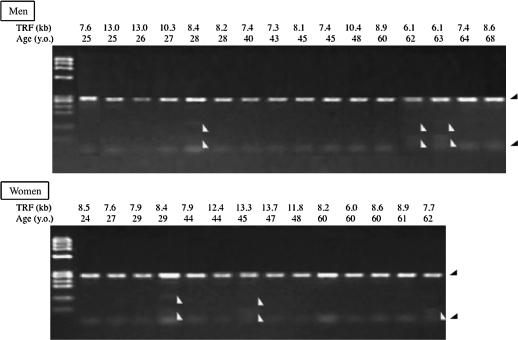
Methods: Telomere lengths of the peripheral blood cells of 148 normal Japanese were analyzed by Southern blotting using methylation-sensitive and -insensitive isoschizomers.
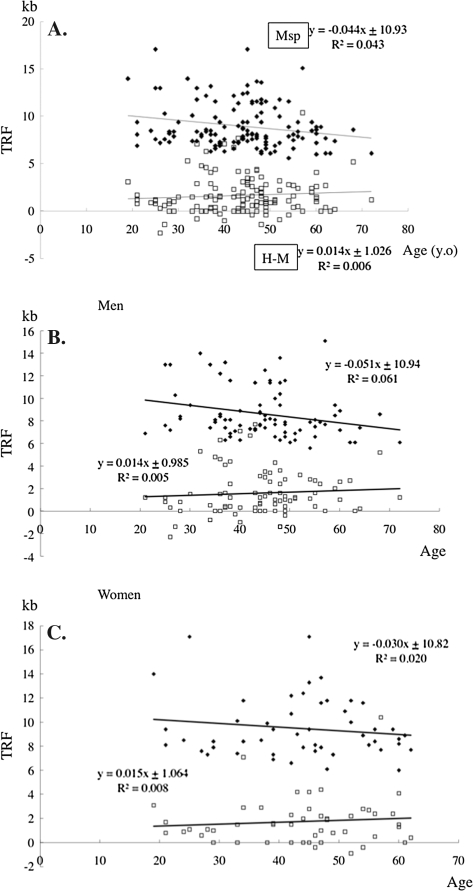
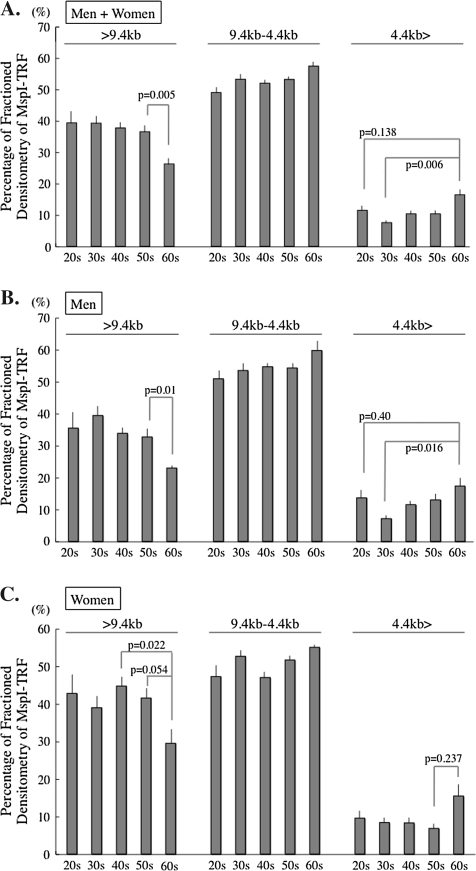
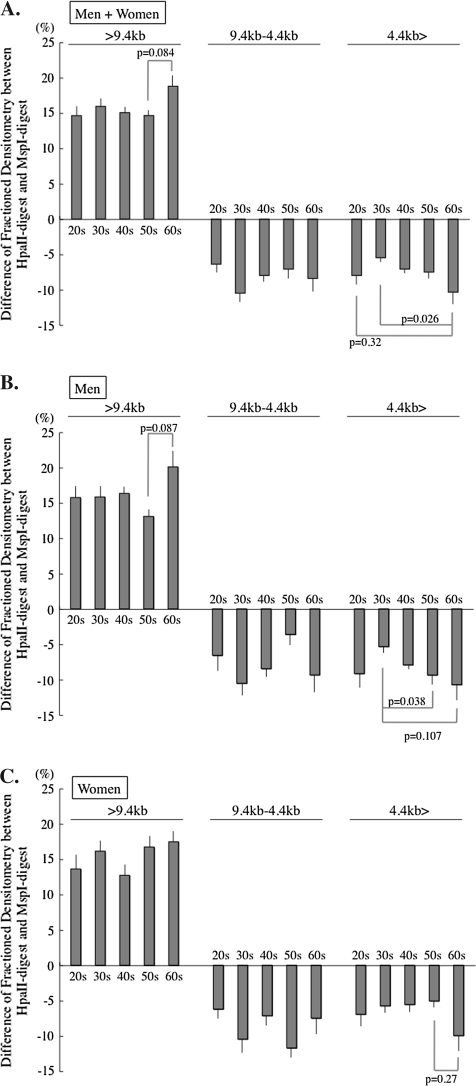
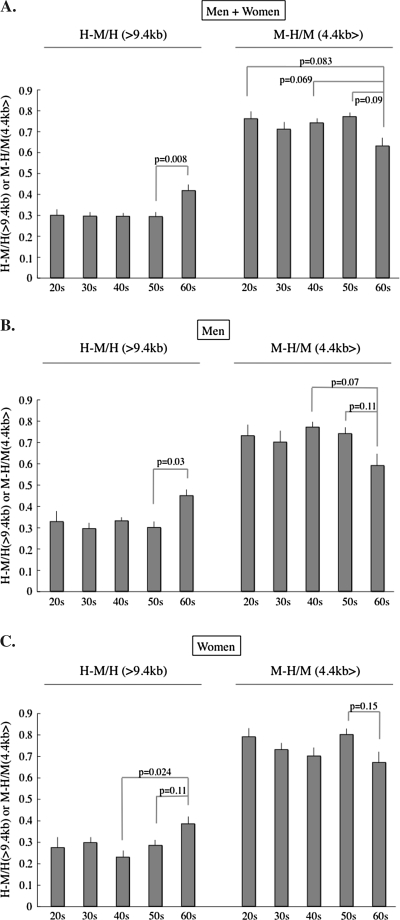
Results: With aging, long telomeres decrease and short telomeres increase, and the contents of the telomeres with methylated subtelomere increase in long telomeres, thus leading us to postulate that telomeres with less methylated subtelomeres tend to become shortened faster.
Conclusions: A telomere length distribution analysis with methylation-sensitive and -insensitive isoschizomer seems to be a useful tool to assess the subtelomeric methylation status of the somatic cell population. The subtelomeric methylation of peripheral blood cells is also indicated to be an indicator for aging-associated genomic changes.
Figures
Similar articles
-
Epigenetic status of subtelomere of peripheral leukocytes corresponds to cardiographic parameters with a sex association.Geriatr Gerontol Int. 2018 Sep;18(9):1415-1419. doi: 10.1111/ggi.13472. Epub 2018 Jul 5. Geriatr Gerontol Int. 2018. PMID: 29978589
-
Aging-related alterations of subtelomeric methylation in sarcoidosis patients.J Gerontol A Biol Sci Med Sci. 2009 Jul;64(7):752-60. doi: 10.1093/gerona/glp049. Epub 2009 May 4. J Gerontol A Biol Sci Med Sci. 2009. PMID: 19414507
-
The Subtelomere of Short Telomeres is Hypermethylated in Alzheimer's Disease.Aging Dis. 2012 Apr;3(2):164-70. Epub 2011 Dec 10. Aging Dis. 2012. PMID: 22724077 Free PMC article.
-
The Alteration of Subtelomeric DNA Methylation in Aging-Related Diseases.Front Genet. 2019 Jan 9;9:697. doi: 10.3389/fgene.2018.00697. eCollection 2018. Front Genet. 2019. PMID: 30687384 Free PMC article. Review.
-
Is Evidence Supporting the Subtelomere-Telomere Theory of Aging?Biochemistry (Mosc). 2021 Dec;86(12):1526-1539. doi: 10.1134/S0006297921120026. Biochemistry (Mosc). 2021. PMID: 34937532 Review.
Cited by
-
Gender and telomere length: systematic review and meta-analysis.Exp Gerontol. 2014 Mar;51:15-27. doi: 10.1016/j.exger.2013.12.004. Epub 2013 Dec 21. Exp Gerontol. 2014. PMID: 24365661 Free PMC article.
-
Human leukocyte telomere length is associated with DNA methylation levels in multiple subtelomeric and imprinted loci.Sci Rep. 2014 May 14;4:4954. doi: 10.1038/srep04954. Sci Rep. 2014. PMID: 24828261 Free PMC article.
-
Epigenetic changes in response to tai chi practice: a pilot investigation of DNA methylation marks.Evid Based Complement Alternat Med. 2012;2012:841810. doi: 10.1155/2012/841810. Epub 2012 Jun 5. Evid Based Complement Alternat Med. 2012. PMID: 22719790 Free PMC article.
-
Ageing affects subtelomeric DNA methylation in blood cells from a large European population enrolled in the MARK-AGE study.Geroscience. 2021 Jun;43(3):1283-1302. doi: 10.1007/s11357-021-00347-9. Epub 2021 Apr 19. Geroscience. 2021. PMID: 33870444 Free PMC article.
-
Frailty is associated with the epigenetic clock but not with telomere length in a German cohort.Clin Epigenetics. 2016 Feb 26;8:21. doi: 10.1186/s13148-016-0186-5. eCollection 2016. Clin Epigenetics. 2016. PMID: 26925173 Free PMC article.
References
-
- McEachern MJ, Krauskopf A, Blackburn EH. Telomeres and their control. Annu Rev Genet. 2000;34:331–358. - PubMed
-
- Hayflick L. The limited in vitro lifetime of human diploid cell strains. Exp Cell Res. 1965;37:614–636. - PubMed
-
- Harley CB, Futcher AB, Greider CW. Telomeres shorten during ageing of human fibroblast. Nature. 1990;345:458–460. - PubMed
-
- Ju Z, Rudolph KL. Telomeres and telomerase in cancer stem cells. Eur J Cancer. 2006;42:1197–1203. - PubMed
-
- Shay JW, Wright WE. Hallmarks of telomeres in ageing research. J Pathol. 2007;211:114–123. - PubMed
Publication types
MeSH terms
LinkOut - more resources
Full Text Sources
Medical
