. 2009 May;329(2):791-807.
doi: 10.1124/jpet.108.150151. Epub 2009 Feb 17.

Activation and desensitization of nicotinic alpha7-type acetylcholine receptors by benzylidene anabaseines and nicotine

Affiliations

Activation and desensitization of nicotinic alpha7-type acetylcholine receptors by benzylidene anabaseines and nicotine

Roger L Papke et al. J Pharmacol Exp Ther. 2009 May.

Abstract

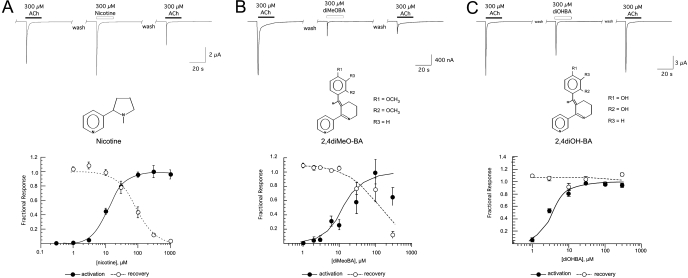
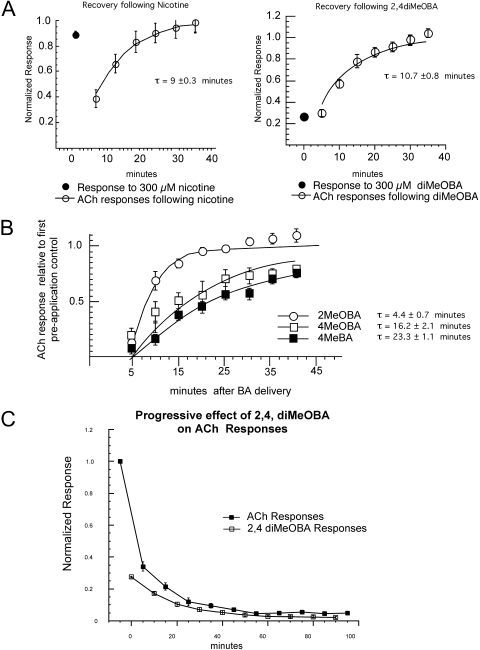
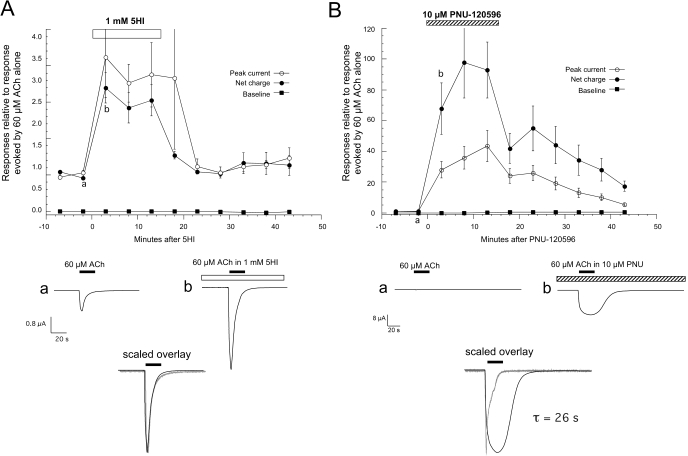
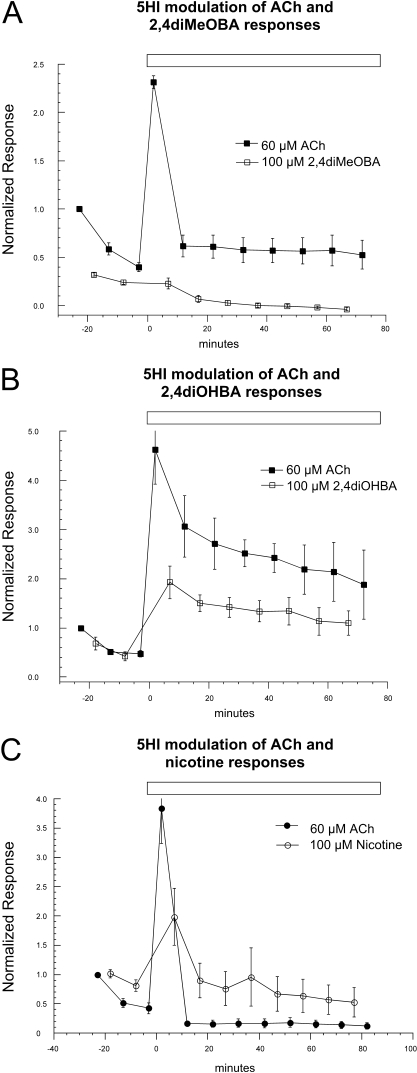
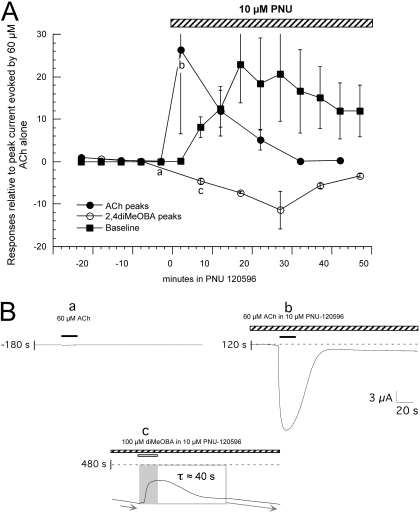
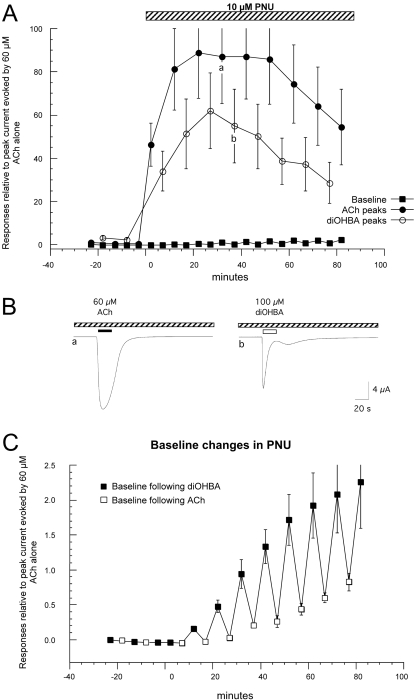
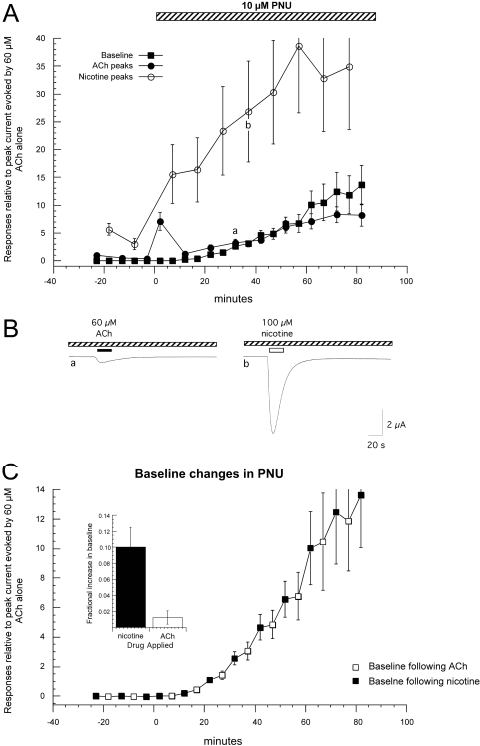
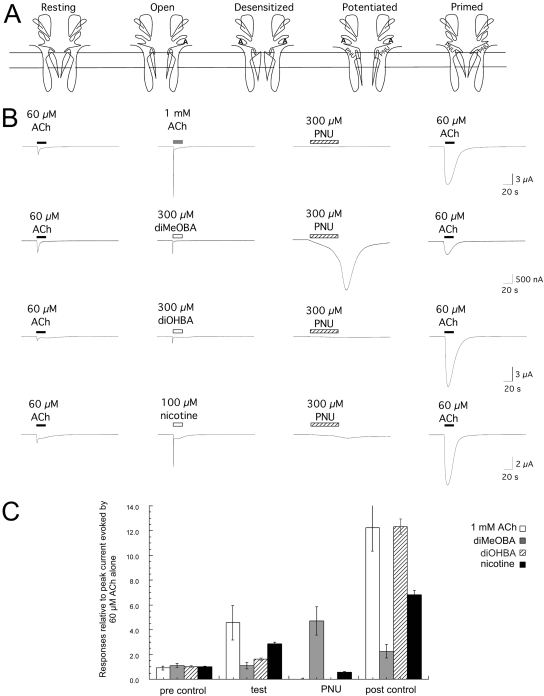
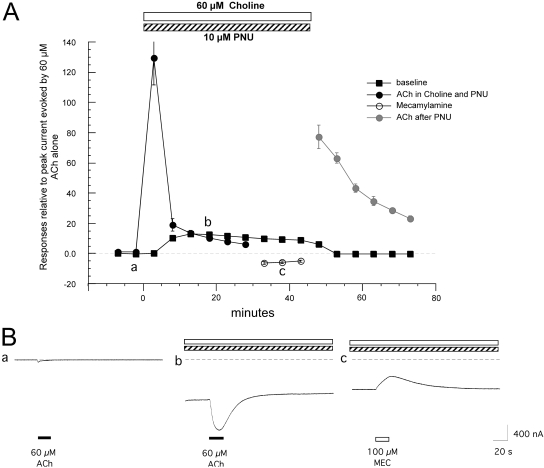
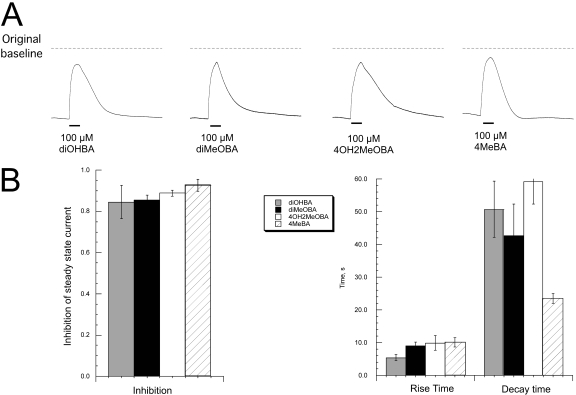
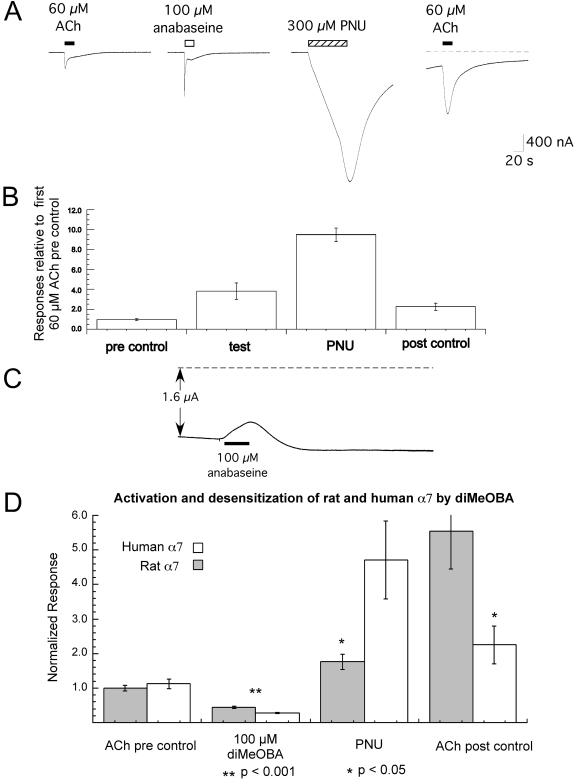
Nicotinic receptor activation is inextricably linked to desensitization. This duality affects our ability to develop useful therapeutics targeting nicotinic acetylcholine receptor (nAChR). Nicotine and some alpha7-selective experimental partial agonists produce a transient activation of alpha7 receptors followed by a period of prolonged residual inhibition or desensitization (RID). The object of the present study was to determine whether RID was primarily due to prolonged desensitization or due to channel block. To make this determination, we used agents that varied significantly in their production of RID and two alpha7-selective positive allosteric modulators (PAMs): 5-hydroxyindole (5HI), a type 1 PAM that does not prevent desensitization; and 1-(5-chloro-2,4-dimethoxy-phenyl)-3-(5-methyl-isoxanol-3-yl)-urea (PNU-120596), a type 2 PAM that reactivates desensitized receptors. The RID-producing compounds nicotine and 3-(2,4-dimethoxybenzylidene)anabaseine (diMeOBA) could obscure the potentiating effects of 5HI. However, through the use of nicotine, diMeOBA, and the RID-negative compound 3-(2,4-dihydroxybenzylidene)anabaseine (diOHBA) in combination with PNU-120596, we confirmed that diMeOBA produces short-lived channel block of alpha7 but that RID is because of the induction of a desensitized state that is stable in the absence of PNU-120596 and activated in the presence of PNU-120596. In contrast, diOHBA produced channel block but only readily reversible desensitization, whereas nicotine produced desensitization that could be converted into activation by PNU-120596 but no demonstrable channel block. Steady-state currents through receptors that would otherwise be desensitized could also be produced by the application of PNU-120596 in the presence of a physiologically relevant concentration of choline (60 microM), which may be significant for the therapeutic development of type 2 PAMs.


Figures

Fig. 1.
Fig. 1.
Activation and RID of α7 nAChR by (-)-nicotine and BAs. A, representative raw data traces showing the stimulation of α7 receptors by a high concentration of nicotine compared with a prior ACh control response in the same cell are shown at the top. The right-most trace shows an ACh response obtained subsequent to the nicotine-evoked response. Below, the activation and inhibition data (net charge) obtained from multiple cells. The progressive decrease in recovery values is indicative of RID. B, partial agonist activity and strong RID produced by diMeOBA. Representative raw data traces are shown at the top, illustrating the RID of α7 nAChR produced after transient activation by diMeOBA (GTS-21 or DMXBA). The concentration dependence data obtained from multiple cells are plotted below, as described for A. C, partial agonist activity and absence of RID produced by diOHBA. A to C, to visualize the respective concentration dependence of activation and RID, activation data (net charge) are plotted relative to the maximal activation produced by the specific drugs, which was 80, 10, and 47% that of maximal ACh-evoked (net charge) responses for nicotine, diMeOBA, and diOHBA, respectively. Recovery was calculated as the ratio of a 300 μM ACh-evoked response obtained after an application of nicotine or the BA compounds to that of the 300 μM ACh-evoked response obtained before the application of nicotine or a BA compound. Each point is the average (± S.E.M.) of at least four oocytes. Note that for the concentrations of nicotine and diMeOBA >30 μM, determination of activation and subsequent recovery had to be made on separate sets of oocytes, normalized to their own internal ACh controls, because cells did not recover adequately after the application of nicotine or diMeOBA at those concentrations for further repeated measurements to be made on the same cells.
Fig. 2.
Fig. 2.
Evaluation of recovery rates with repeated ACh application after RID produced by experimental agonists. A, concentrations of either nicotine or diMeOBA sufficient to produce ≥50% residual inhibition were made to oocytes expressing α7. Cells were washed and repeatedly stimulated with ACh to evaluate the rates of recovery. B, recovery time constants varied for the RID produced by various BAs, based on the chemical character and position of the benzylidene side groups. C, because of the slow recovery from the diMeOBA-induced residual inhibition/desensitization, inhibition of both 60 μM ACh- and 100 μM diMeOBA-evoked responses can progressively accumulate with repeated applications of diMeOBA. To show the change in both ACh and diMeOBA responses over time, all data were normalized to the initial ACh response from each oocyte.
Fig. 3.
Fig. 3.
Enhancement of ACh-evoked α7-mediated currents by PAMs. A, the rapid and transient increase in ACh-evoked responses produced by the type 1 modulator 5HI. After two initial control applications of 60 μM ACh, the bath solution was switched to one containing 1 mM 5HI, and ACh was then coapplied with 5HI three times before the bath solution was switched back to control Ringer's solution. Responses (net charge) were normalized to the average of the two pre-5HI control responses in each cell. Each point is the average (± S.E.M.) of at least four oocytes. Responses obtained at points a and b from a single oocyte in the experiment are shown below. The black bars represent the timing and duration of agonist application. Note that the responses were increased in amplitude but not duration, as shown in the overlay of the two currents, scaled to the same peak amplitude. B, multiple responses of α7-expressing oocytes obtained in the presence of the type 2 modulator PNU-120596 (PNU). To normalize the data from multiple oocytes (n = 3), the peak current and baseline data were calculated relative to the peak amplitude of initial ACh control responses for each cell (correcting for the small holding current before the initial control application of ACh). Net charge measures were normalized based on the net charge of the initial ACh controls. Shown below are representative responses evoked by the application of 60 μM ACh in the absence and presence of PNU-120596 (traces obtained at points a and b in B, respectively). Also shown is the response to ACh alone (gray) increased in scale in the lower traces and overlaid with an ACh response obtained in the presence of PNU-120596 to show how, characteristically for a type 2 PAM, ACh responses in the presence of PNU-120596 were increased in both amplitude and duration.
Fig. 4.
Fig. 4.
Interactions between a type 1 PAM and compounds producing varying amounts of RID. Alternating applications of ACh and either diMeOBA, diOHBA, or nicotine (A, B, and C, respectively) were made before and after switching to a bath solution containing 1 mM 5HI. Responses were normalized to the first control ACh responses of each cell. The data represent the average responses of five cells ± S.E.M. at each time point.
Fig. 5.
Fig. 5.
PNU-120596 in combination with diMeOBA and ACh. A, average values (± S.E.M.) from three cells treated with 60 μM ACh and 100 μM diMeOBA applied in alternation before and after the addition of 10 μM PNU-120596 (PNU) to the bath. To normalize the data, the peak current and baseline data were calculated relative to the peak amplitude of the initial ACh control for each cell (correcting for the small holding current before the initial control application of ACh). B, the topmost traces shown are ACh-evoked responses just before (a) and 3 min after (b) the switch to the PNU-containing bath solution. Note that the ACh-evoked response before PNU-120596 is particularly small because it has been decreased because of the residual inhibition/desensitization produced by the prior applications of diMeOBA. As indicated in A, there were large increases in holding current after the applications of diMeOBA in the presence of PNU-120596, indicative of steady-state activation of the α7 receptors. In addition to this effect on holding current, applications of 100 μM diMeOBA produced transient decreases in the progressively increasing steady-state current (arrows), as illustrated in the bottom trace. Shown is a diMeOBA response obtained 480 s after application of PNU-120596 (c in A). The decreases in the inward current were of approximately the same duration as the drug application and reversed on the time scale of solution washout (Papke and Thinschmidt, 1998).
Fig. 6.
Fig. 6.
PNU-120596 in combination with ACh and diOHBA. A, average values (± S.E.M.) from four cells treated with 60 μM ACh and 100 μM diOHBA applied in alternation, before and after the addition of 10 μM PNU-120596 to the bath. To normalize the data, the peak current and baseline data were calculated relative to the peak amplitude of the initial ACh control for each cell (correcting for the small holding current before the initial control application of ACh). B, shown are the fourth ACh and diOHBA responses obtained after application of PNU-120596 (from points a and b in A, respectively). C, baseline current levels expressed relative to initial ACh-evoked responses are plotted at an enlarged scale and show that there were oscillations associated with which agonist had most recently been applied. The baseline currents were measured just before the application of either ACh or diOHBA, so that changes in baseline current were the result of the preceding drug applications.
Fig. 7.
Fig. 7.
PNU-120596 in combination with nicotine and ACh. A, average values (±S.E.M.) from six cells treated with 60 μM ACh and 100 μM nicotine applied in alternation, before and after the addition of 10 μM PNU-120596 to the bath. To normalize the data, the peak current and baseline data were calculated relative to the peak amplitude of the initial ACh control for each cell (correcting for the small holding current before the initial control application of ACh). B, shown are the fourth ACh and nicotine responses obtained after application of PNU-120596 (from points a and b in A, respectively). C, baseline current levels expressed relative to initial ACh-evoked responses are plotted at an enlarged scale and show that there were oscillations associated with which agonist had most recently been applied. The inset shows a plot of the percentage of the total change in baseline currents associated with the applications of ACh or nicotine. On average, the increase in baseline current after the applications of nicotine were 10-fold higher than after the applications of ACh.
Fig. 8.
Fig. 8.
A, schematic representation of the conducting and nonconducting states of α7 nAChR: the unbound resting state; the open activated state, which is transiently promoted by low to intermediate levels of agonist binding; the desensitized closed state, which predominates once multiple ligand binding sites have been occupied by agonist; the potentiated (desensitization resistant) conducting state, which requires both the binding of agonist and a type 2 allosteric modulator; and the allosterically primed state, which will readily convert to the potentiated conducting state upon the binding of agonist. B, PNU-120596 applied alone reverses RID. Shown are representative responses from single oocytes to 60 μM ACh and then either ACh at 1 mM (a concentration that produces essentially instantaneous desensitization) or the experimental agonists at the indicated concentrations. Cells were then washed with control buffer, and after 5 min 300 μM PNU-120596 (PNU) was applied for 60 s. The high concentration of PNU-120596 was used to achieve a rapid onset of potentiation. Five minutes after application of PNU alone, ACh was again applied at a concentration of 60 μM. C, average values (± S.E.M.) from at least six cells under each of the application conditions shown in B. To normalize the data, the peak current data were calculated relative to the peak amplitude of an initial ACh control response for each cell (obtained 5 min before the 60 μM ACh responses shown in A).
Fig. 9.
Fig. 9.
PNU-120596 in combination with choline and ACh. A, average values (±S.E.M.) from five cells treated with 60 μM ACh, before and after the addition of 10 μM PNU-120596 plus 60 μM choline to the bath. To normalize the data, the peak current and baseline data were calculated relative to the peak amplitude of the initial ACh control response for each cell (correcting for the small holding current before the initial control application of ACh). After evoking six responses to 60 μM ACh in the presence of PNU-120596 and choline, three applications of 100 μM mecamylamine (open circles) were made to confirm that the steady-state current was receptor-mediated. Each application of mecamylamine produced a transient decrease in the steady-state current (shown as negative peaks). B, shown are representative ACh-evoked responses from a single oocyte obtained before the addition of PNU-120596 and choline (point a), a PNU-120596-potentiated response recorded on top of a large steady-state current (point b), and a mecamylamine-induced reduction in baseline current.
Fig. 10.
Fig. 10.
Block of steady-state currents by BA compounds. Cells expressing α7 were exposed to bath solution containing 60 μM choline and 10 μM PNU-120596 and stimulated at 5-min intervals with 60 μM ACh until the transient ACh-evoked currents were roughly equal to the steady-state current (point b in Fig. 9). They were then given 12-s applications of the BA compounds. A, averaged traces obtained from six oocytes stimulated in parallel. The traces are shown relative to the average steady-state current and the original current baselines (dashed lines). B, magnitude and kinetics of the block of steady-state currents by BA compounds. As indicated by the graph on the left, each BA was able to block 80 to 90% of the steady-state currents. The rise time of the block was measured from the 20 to 90% points on the deflection from the steady-state current to the peak of the block. The decay times were measured from the 90 to 20% points on the return to the steady-state condition.
Fig. 11.
Fig. 11.
A to C, desensitizing and blocking activity of anabaseine. A, shown are representative responses from a single oocyte to 60 μM ACh and then to 100 μM anabaseine. The cell was then washed with control buffer, and after 5 min 300 μM PNU-120596 (PNU) was applied for 60 s. Five minutes after application of PNU alone, ACh was again applied at a concentration of 60 μM. B, average values (± S.E.M.) from at least six cells under each of the application conditions shown in A. To normalize the data, the peak-current data were calculated relative to the peak amplitude of an initial ACh control response for each cell (obtained 5 min before the 60 μM ACh responses shown in A). C, cells expressing α7 were exposed to bath solution containing 60 μM choline and 10 μM PNU and stimulated at 5-min intervals with 60 μM ACh until the transient ACh-evoked currents were roughly equal to the steady-state current (point b in Fig. 9). Cells were then given 20-s applications of anabaseine. Shown is a representative blocking response of the steady-state current, relative to the original current baselines (dashed line). On average, 100 μM anabaseine only blocked 32 ± 5% of the steady-state current (n = 3), and the blockade was relatively transient (90–20% fall time of 18 ± 1 s; n = 3). D, stable desensitization of human α7 by diMeOBA associated with reduced efficacy compared with rat α7. Net charge responses of rat and human α7 to the application of 100 μM diMeOBA were measured relative to a preapplication 60 μM ACh control response, and after washout cells were treated with 300 μM PNU-120596. Five minutes after application of PNU alone, ACh was again applied at a concentration of 60 μM. Plotted are the average responses of six or more cells under each condition (± S.E.M.).

Similar articles

Cited by

References

    1. Bertrand D, Bertrand S, Cassar S, Gubbins E, Li J, and Gopalakrishnan M (2008) Positive allosteric modulation of the alpha7 nicotinic acetylcholine receptor: ligand interactions with distinct binding sites and evidence for a prominent role of the M2–M3 segment. Mol Pharmacol 74 1407-1416. - PubMed
    1. Briggs CA, Anderson DJ, Brioni JD, Buccafusco JJ, Buckley MJ, Campbell JE, Decker MW, Donnelly-Roberts D, Elliott RL, Gopalakrishnan M, et al. (1997) Functional characterization of the novel nicotinic receptor ligand GTS-21 in vitro and in vivo. Pharmacol Biochem Behav 57 231-241. - PubMed
    1. de Fiebre CM, Meyer EM, Henry JC, Muraskin SI, Kem WR, and Papke RL (1995) Characterization of a family of anabaseine-derived compounds reveals that the 3-(4)-dimethylaminocinnamylidine derivative (DMAC) is a selective agonist at neuronal nicotinic α7/[125I]α-bungarotoxin receptor subtypes. Mol Pharmacol 47 164-171. - PubMed
    1. Farooqui AA and Horrocks LA (1994) Excitotoxicity and neurological disorders: involvement of membrane phospholipids. Int Rev Neurobiol 36 267-323. - PubMed
    1. Frazier CJ, Strowbridge BW, and Papke RL (2003) Nicotinic acetylcholine receptors on local circuit neurons in the dentate gyrus: a potential role in the regulation of granule cell excitability. J Neurophysiol 89 3018-3028. - PubMed

Publication types

MeSH terms