

Correction of megavoltage cone-beam CT images of the pelvic region based on phantom measurements for dose calculation purposes
- PMID: 19223832
- PMCID: PMC5720499
- DOI: 10.1120/jacmp.v10i1.2852
Correction of megavoltage cone-beam CT images of the pelvic region based on phantom measurements for dose calculation purposes
Abstract
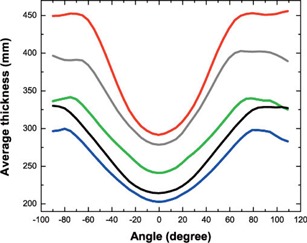
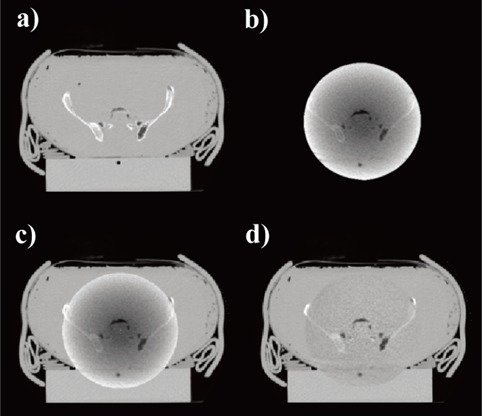
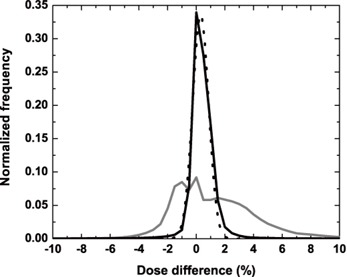
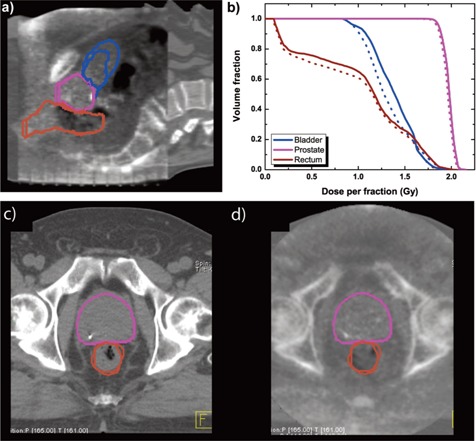
Megavoltage cone-beam CT (MVCBCT) is an imaging technology that provides a 3D representation of the patient in treatment position. Because it is a form of x-ray tomography, MVCBCT images give information about the attenuation coefficients of the imaged tissues, and thus could be used for dose calculation. However, the cupping and missing data artifacts seen on MVCBCT images can cause inaccuracies in dose calculations. To eliminate these inaccuracies, a correction method specific to pelvis imaging and based on phantom measurements has been devised. Pelvis-shaped water phantoms of three different sizes were designed and imaged with MVCBCT. Three sets of correction factors were created from the artifacts observed in these MVCBCT images by dividing the measured CT number by the predefined CT number for water. Linear interpolation is performed between the sets of correction factors to take into account the varying size of different patients. To compensate for the missing anatomy due to the limited field of view of the MVCBCT system, the MVCBCT image is complemented with the kilovoltage CT (kVCT) image acquired for treatment planning.When the correction method is applied to an anthropomorphic pelvis phantom, the standard deviation between dose calculations performed with kVCT and MVCBCT images is 0.6%, with 98% of the dose points agreeing within +/- 3%.With uncorrected MVCBCT images this percentage falls to 75%. An example of dose calculation performed with a corrected clinicalMVCBCT image of a prostate cancer patient shows that changes in anatomy of normal tissues result in variation of the dose distribution received by these tissues.This correction method enablesMVCBCT images to be used for the verification of the daily dose distribution for patients treated in the pelvis region.
Figures


Similar articles
-
Correction of megavoltage cone-beam CT images for dose calculation in the head and neck region.Med Phys. 2008 Mar;35(3):900-7. doi: 10.1118/1.2839146. Med Phys. 2008. PMID: 18404926
-
Patient dose considerations for routine megavoltage cone-beam CT imaging.Med Phys. 2007 May;34(5):1819-27. doi: 10.1118/1.2722470. Med Phys. 2007. PMID: 17555263
-
Dose calculation using megavoltage cone-beam CT.Int J Radiat Oncol Biol Phys. 2007 Mar 15;67(4):1201-10. doi: 10.1016/j.ijrobp.2006.10.048. Int J Radiat Oncol Biol Phys. 2007. PMID: 17336221
-
[Dose delivered to the patient by megavoltage cone beam computed tomography imaging].Cancer Radiother. 2009 Sep;13(5):358-64. doi: 10.1016/j.canrad.2009.05.010. Epub 2009 Jul 28. Cancer Radiother. 2009. PMID: 19640758 French.
-
Physical performance and image optimization of megavoltage cone-beam CT.Med Phys. 2009 Apr;36(4):1421-32. doi: 10.1118/1.3096706. Med Phys. 2009. PMID: 19472649
Cited by
-
Improving synthetic CT accuracy by combining the benefits of multiple normalized preprocesses.J Appl Clin Med Phys. 2023 Aug;24(8):e14004. doi: 10.1002/acm2.14004. Epub 2023 Apr 24. J Appl Clin Med Phys. 2023. PMID: 37092739 Free PMC article.
-
An energy minimization method for the correction of cupping artifacts in cone-beam CT.J Appl Clin Med Phys. 2016 Jul 8;17(4):307-319. doi: 10.1120/jacmp.v17i4.6023. J Appl Clin Med Phys. 2016. PMID: 27455478 Free PMC article.
-
Feasibility of MV CBCT-based treatment planning for urgent radiation therapy: dosimetric accuracy of MV CBCT-based dose calculations.J Appl Clin Med Phys. 2015 Nov 8;16(6):458-471. doi: 10.1120/jacmp.v16i6.5625. J Appl Clin Med Phys. 2015. PMID: 26699575 Free PMC article.
References
-
- Ling CC, Rogers CC, Morton RJ, editors. Computed Tomography in Radiation Therapy. New York (NY): Raven Press; 1983. 284
-
- TenHaken RK, Thornton AF Jr, Sandler HM, et al. A quantitative assessment of the addition of MRI to CT‐based, 3‐D treatment planning of brain tumors. Radiother Oncol. 1992;25:121–131. - PubMed
-
- Fraass BA. The development of conformal radiation therapy. Med Phys. 1995. Nov;22(11 Pt2):1911–1921. - PubMed
-
- Webb S. Intensity‐modulated radiation therapy. 1st ed. Bristol (UK): Institute of Physics Publishing; 2001. 435
-
- Ma CM, Paskalev K. In‐room CT techniques for image‐guided radiation therapy. Med Dosim. 2006. Spring;31(1):30–39. - PubMed
