

Changes in weight, waist circumference and compensatory responses with different doses of exercise among sedentary, overweight postmenopausal women
- PMID: 19223984
- PMCID: PMC2639700
- DOI: 10.1371/journal.pone.0004515
Changes in weight, waist circumference and compensatory responses with different doses of exercise among sedentary, overweight postmenopausal women
Abstract
Background: It has been suggested that exercise training results in compensatory mechanisms that attenuate weight loss. However, this has only been examined with large doses of exercise. The goal of this analysis was to examine actual weight loss compared to predicted weight loss (compensation) across different doses of exercise in a controlled trial of sedentary, overweight or obese postmenopausal women (n = 411).
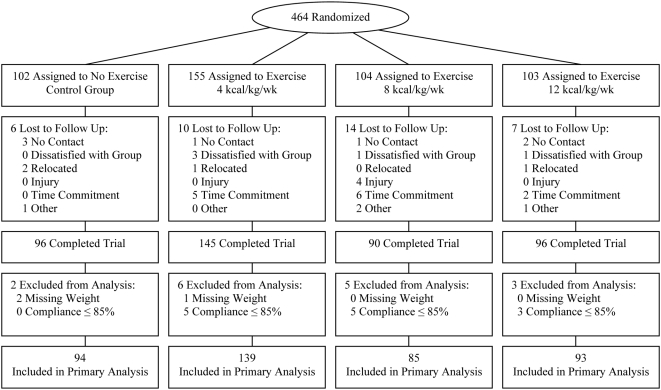
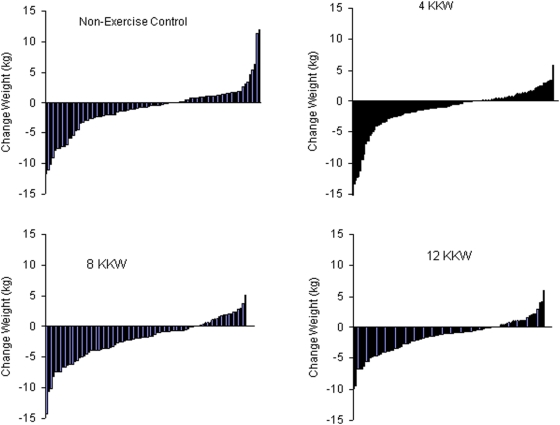
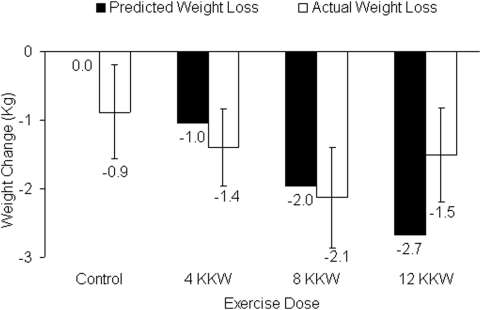
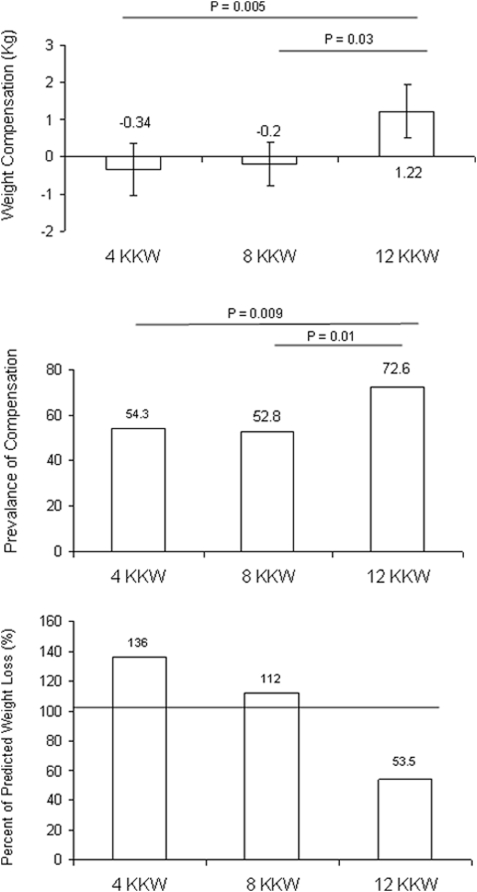
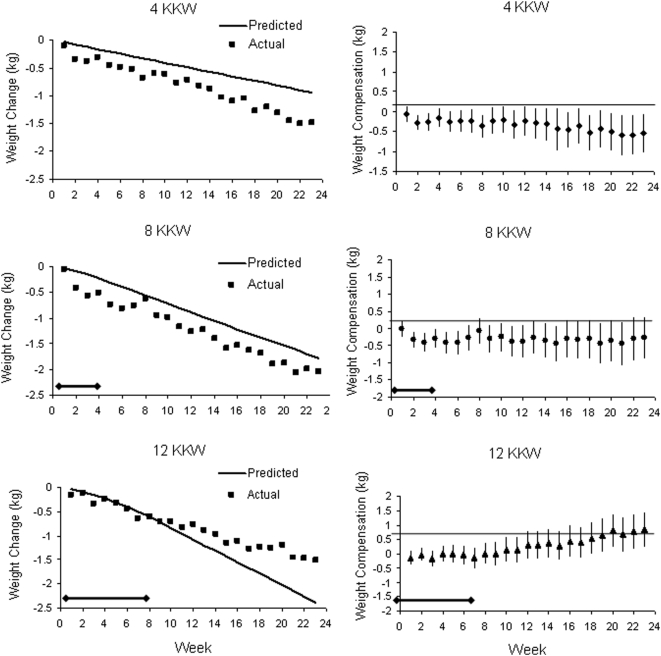
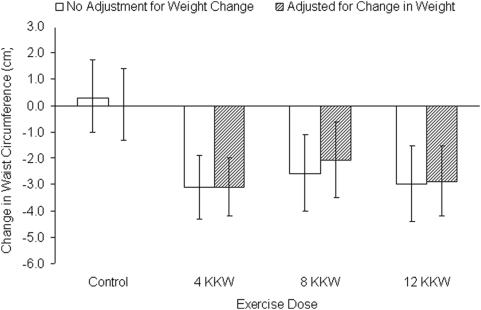
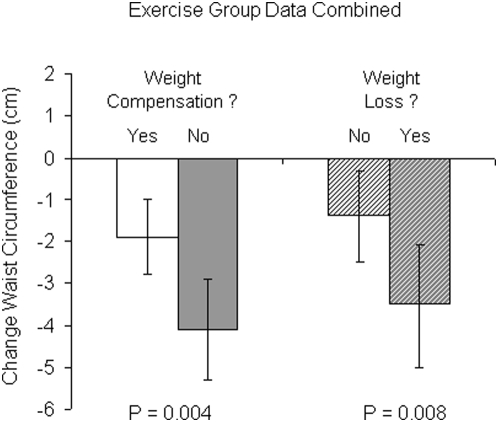
Methodology/principal findings: Participants were randomized to a non-exercise control (n = 94) or 1 of 3 exercise groups; exercise energy expenditure of 4 (n = 139), 8 (n = 85), or 12 (n = 93) kcal/kg/week (KKW). Training intensity was set at the heart rate associated with 50% of each woman's peak VO(2) and the intervention period was 6 months. All exercise was supervised. The main outcomes were actual weight loss, predicted weight loss (exercise energy expenditure/ 7700 kcal per kg), compensation (actual minus predicted weight loss) and waist circumference. The study sample had a mean (SD) age 57.2 (6.3) years, BMI of 31.7 (3.8) kg/m(2), and was 63.5% Caucasian. The adherence to the intervention was >99% in all exercise groups. The mean (95% CI) weight loss in the 4, 8 and 12 KKW groups was -1.4 (-2.0, -0.8), -2.1 (-2.9, -1.4) and -1.5 (-2.2, -0.8) kg, respectively. In the 4 and 8 KKW groups the actual weight loss closely matched the predicted weight loss of -1.0 and -2.0 kg, respectively, resulting in no significant compensation. In the 12 KKW group the actual weight loss was less than the predicted weight loss (-2.7 kg) resulting in 1.2 (0.5, 1.9) kg of compensation (P<0.05 compared to 4 and 8 KKW groups). All exercise groups had a significant reduction in waist circumference which was independent of changes in weight.
Conclusion: In this study of previously sedentary, overweight or obese, postmenopausal women we observed no difference in the actual and predicted weight loss with 4 and 8 KKW of exercise (72 and 136 minutes respectively), while the 12 KKW (194 minutes) produced only about half of the predicted weight loss. However, all exercise groups had a significant reduction in waist circumference which was independent of changes in weight.
Trial registration: (ClinicalTrials.gov) NCT00011193.
Conflict of interest statement
Figures
References
-
- World Health Organization. 1998:1–276. Obesity: Preventing and managing the global epidemic.
-
- Ogden CL, Carroll MD, Curtin LR, McDowell MA, Tabak CJ, et al. Prevalence of overweight and obesity in the United States, 1999–2004. JAMA. 2006;295:1549–1555. - PubMed
-
- Hossain P, Kawar B, El NM. Obesity and diabetes in the developing world–a growing challenge. N Engl J Med. 2007;356:213–215. - PubMed
-
- Ludwig DS. Childhood obesity–the shape of things to come. N Engl J Med. 2007;357:2325–2327. - PubMed
-
- Jakicic JM, Clark K, Coleman E, Donnelly JE, Foreyt J, et al. American College of Sports Medicine position stand. Appropriate intervention strategies for weight loss and prevention of weight regain for adults. Med Sci Sports Exerc. 2001;33:2145–2156. - PubMed
Publication types
MeSH terms
Associated data
Grants and funding
LinkOut - more resources
Full Text Sources
Medical
