

Review
doi: 10.1007/s12350-009-9060-6.
Epub 2009 Feb 18.
Applications of optical coherence tomography in cardiovascular medicine, part 1
Affiliations
- PMID: 19224151
- PMCID: PMC4352580
- DOI: 10.1007/s12350-009-9060-6
Item in Clipboard
Review
Applications of optical coherence tomography in cardiovascular medicine, part 1
J Nucl Cardiol.
2009 Mar-Apr.
No abstract available
Figures

Absorption coefficients of water and hemoglobin in the visible and the near-infrared. Water is almost perfectly transparent in the visible wavelengths, but begins to absorb strongly as the wavelength increases in the infrared. The absorption of hemoglobin is similar to lipid and arterial wall components. Note the overall decrease in absorption of hemoglobin as the wavelength increases in the near-infrared (reproduced with permission from12).
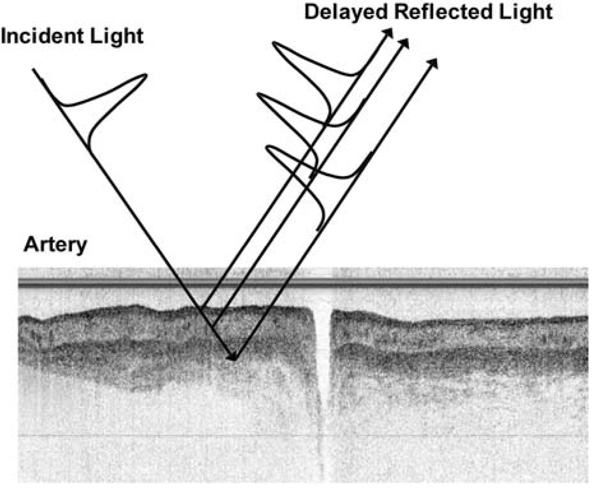
An OCT image is a gray scale image of the intensity of back reflected light from deep in a peripheral artery (adapted from images courtesy of Drs. Roger Gammon and Frank Zidar, Austin Heart Hospital, Austin, Texas).
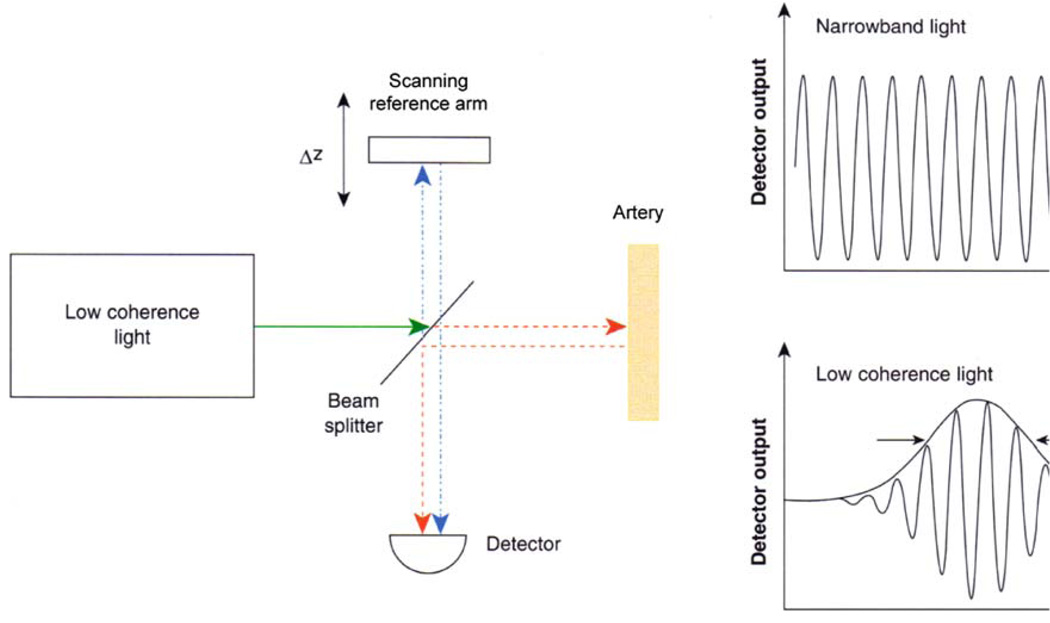
Schematic of a low-coherence interferometer used for time-domain OCT. Back-reflected light from the tissue being imaged interferes with light traveling a known reference path. The mirror in the reference path is mechanically scanned in order to produce a time-varying change in path length. When a low-coherence light source is used, interference will be observed only when the reference and tissue path lengths are the same. This time domain detection method measures back-reflections sequentially at different depths in the tissue as the reference mirror is scanned (adapted with permission from2).

Scanning pattern used to create a B-scan OCT image. Serial axial reflection measurements (in depth) are performed as the tissue is scanned in the lateral direction. The result is a 2-dimensional image analogous to B-mode ultrasound. (Adapted from images courtesy of Drs. Roger Gammon and Frank Zidar, Austin Heart Hospital, Austin, Texas).
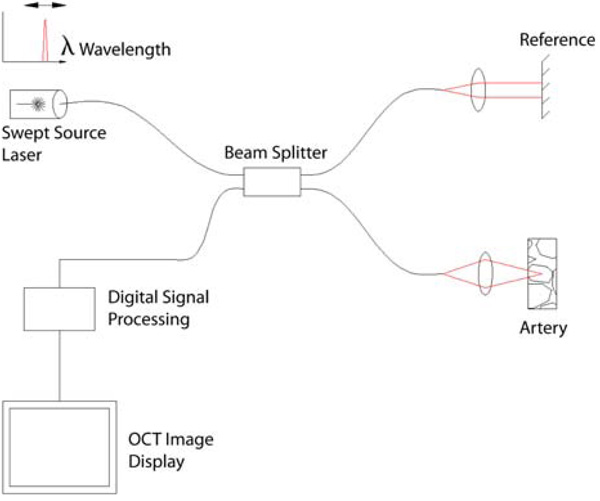
A schematic of a swept source OCT system, a type of Fourier domain OCT that provides much faster imaging speeds than time-domain OCT (adapted from http://en.wikipedia.org/wiki/File:Ss-oct.PNG ).

A 3.2 Fr CorVue® catheter tip from Volcano Corporation. A rotating optical fiber coupled to a distal lens and microprism are encased in transparent housing that inserts over a guide wire. As the optical cable spins, the OCT beam is directed radially outward toward the vessel wall (courtesy of Volcano Corporation, San Antonio, TX and Rancho Cordova, CA).

A Catheter tip is positioned in the vessel distal to the lesion. Note that blood, a strong scatterer of light, fills the lumen of the vessel. B Imaging begins. As the catheter tip spins (blue whirl), the OCT beam is aimed radially outward toward the vessel wall to create a cross-sectional image of the vessel. A 50:50 mixture of saline: Iodixanol (Visipaque®) is injected to clear red blood cells from the imaging field. C The catheter tip is pulled back proximally. The tip continues to spin and, in a reduced red blood cell environment, captures a cross-sectional image of vessel pathology and the associated intervention (courtesy of Volcano Corporation, San Antonio, TX and Rancho Cordova, CA).

Optical properties of several dilutions of murine blood with Oxyglobin®. The reduced scattering coefficient is dependent on the number of RBCs per unit volume. The absorption coefficient (µa) depends on the concentration of hemoglobin. Hct indicates hematocrit (reproduced with permission from6).

Saline versus 50:50 saline:Iodixanol (Visipaque ®). Before flushing, light scattering by red blood cells prevents imaging of the vessel wall. After flushing with saline or saline/contrast mixture, red blood cells are removed from the imaging field and the vessel wall is apparent. Note the earlier, longer, and more complete clearance of RBCs by the saline/contrast mixture. Both imaging studies were performed in the LAD of a 70 kg pig with flushing at 4 mL/second with power injection (Medrad Mark IV power injector, Medrad Inc, Pittsburgh), total 20 mL flush. Images taken with the Volcano CorVue® Fourier Domain OCT system (Volcano Corporation, San Antonio, TX and Rancho Cordova, CA).

Upper panel: reflector (mirror) was placed in tubing as shown. Section of reflector imaged is 2 mm below inner surface of tubing. Once blood was introduced into system and circulated, OCT imaging of reflector was performed. Lower panel: summary of the impact of dextran, contrast, and saline on light penetration. For saline control, a 7 ± 3% increase in signal intensity was noted (not statistically significant). An increase of 69 ± 12% was noted for dextran, which was statistically different from the saline control (P < .001). For contrast, a 45 ± 4% increase was noted, which was statistically different from control (P < .005) (reproduced with permission from20).

Microscopy images for blood with added dextran saline solution (1.62 g dL-1). Images are taken 15 minutes after the addition of saline control, D ×10, D ×70, and D ×500. Aggregation was time-dependent. Higher molecular weight dextrans induce greater aggregation (reproduced with permission from23).

Classification of drug eluting stent (Cypher®) strut conditions by OCT. A, Well-apposed with neointimal coverage. B, Well-apposed without neointimal coverage. C, Mal-apposed without neointimal coverage (reproduced with permission from44).

Classification of strut/vessel wall apposition by OCT. Frames A–E represent Types I, II, IIIa, IIIb, and IV, respectively. A, Totally embedded strut (Type I). B, Embedded subintimally without disruption of lumen contour (Type II). C, Completely embedded with disruption of lumen contour (Type IIIa). D, Partially embedded with extension of strut into lumen (Type IIIb). E, Complete strut mal-apposition (blood able to exist between strut and lumen wall) (Type IV) (reproduced with permission from45).

Evidence of underdeployment of stents in a live porcine coronary artery. At 12 and 2 o’clock, three edges of the stent strut are evident in the left panel. The Liberte stent strut is 96 µm. If this distance is added to the leading stent strut edge identified with OCT, contact with the lumen wall is still not evident. The right panel demonstrates at 10 o’clock three edges of Taxus stent struts which are 132 µm thick and also mildly underdeployed. Scale: the central structure in the lumen of the vessel is the CorVue OCT catheter system® which has a known diameter of 1.13 mm (courtesy of Volcano Corporation, San Antonio, TX and Rancho Cordova, CA).

LAD of a 46 kg pig which first received a Liberte bare metal stent (96 µm stent, thin arrow), and subsequently a second Taxus drug eluting stent (132 µm, thick arrow). OCT images taken with the CorVue® Fourier Domain OCT System (Volcano Corporation, San Antonio, TX and Rancho Cordova, CA).

Bioabsorbable everolimus eluting coronary stent is shown in the left panel, and the same stent immediately following deployment in a patient is imaged with OCT in the right panel (ABSORB trial) (reproduced with permission from46).

Four patterns of dissolution for bioabsorbable stents evidence with OCT imaging are shown (reproduced with permission from46).

Jailed side branches in a live porcine model immediately following stent placement are identified with OCT. This two figure panel demonstrates two extremes in jailed side branches. The left panel shows a single stent strut covering a jailed side branch, which should allow easy passage of a 0.014 inch angioplasty guide wire to access the side branch. In contrast, the right panel identifies multiple stent struts covering a jailed side branch, which would predict the inability to wire the side branch successfully. These image pairs demonstrate a future use of OCT—the ability to understand the mechanism of jailed side branches which cannot be crossed with an angioplasty wire (courtesy of Volcano Corporation, San Antonio, TX and Rancho Cordova, CA).

LCx artery in a live 50 kg pig which had an oversized balloon inflated (balloon: artery ratio of 1.3:1.0) with a resultant medial tear is shown. OCT images taken with CorVue® Fourier Domain OCT System (Volcano Corporation, San Antonio, TX and Rancho Cordova, CA).

LAD from a live 50 kg pig which was overinflated with a balloon. The arrow identifies the intramural hematoma. The markedly improved resolution of OCT allows for enhanced details such as the tear and blood collection created by an oversized balloon. OCT image taken with CorVue® Fourier Domain OCT System (Volcano Corporation, San Antonio TX and Rancho Cordova, CA).

Tissue prolapse is evident following stent placement. Note the lack of light scattering in the abluminal side of the tissue prolapse, indicating that it is not a red thrombus (courtesy of Volcano Corporation, San Antonio, TX and Rancho Cordova, CA).

Before (left) and after (right) cutting balloon angioplasty. This figure shows the classic appearance of a cutting balloon angioplasty on intimal hyperplasia within a previously placed stent. Prior to intravascular imaging with OCT, the scored cutting ability of this balloon had only been demonstrated with ex vivo tissues, but with OCT, the scored cutting can be visualized in patients (reproduced with permission from50).

Upper panel: longitudinal OCT image of an infrapopliteal vessel. This image was generated by an OCT system incorporated within the NightHawk®. This investigational device lacks a spinning tip, so images are made by push-pulling the catheter in the proximal-distal directions. Note the ability to discriminate the three anatomical diseased vessel layers: intimal hyperplasia, media, and adventitia. Lower panel: atherectomy was performed with the NightHawk®. Note the ability to determine the extent of the excision, consistent with OCT providing immediate feedback to the operator regarding the depth of cutting (courtesy of Dr. Roger Gammon and Dr. Frank Zidar, Austin Heart Hospital, Austin, TX).
References
-
- Regar E, van Leeuwen TG, Serruys PW, editors. Optical coherence tomography in cardiovascular research. 1st ed. London: Informa Healthcare; 2007.
-
- Bouma BE, Tearney GJ, editors. Handbook of optical coherence tomography. 1st ed. New York: Marcel Dekker, Inc; 2002.
Publication types
MeSH terms
Grants and funding
LinkOut - more resources
Full Text Sources
