. 2009 Oct;30(10):3163-71.
doi: 10.1002/hbm.20735.

Distributed representation of single touches in somatosensory and visual cortex

Affiliations

Distributed representation of single touches in somatosensory and visual cortex

Michael S Beauchamp et al. Hum Brain Mapp. 2009 Oct.

Abstract

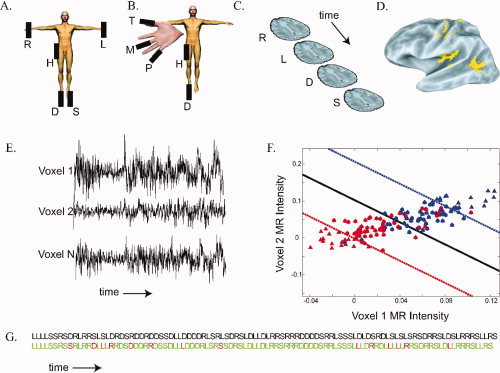
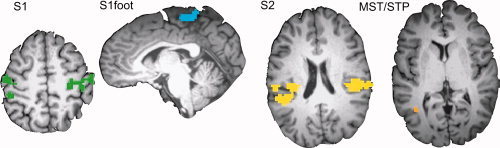
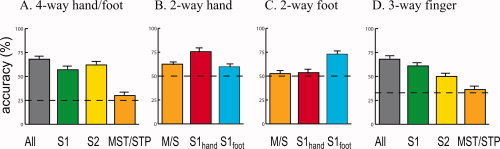
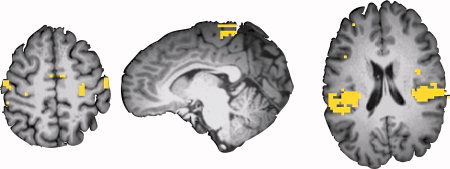
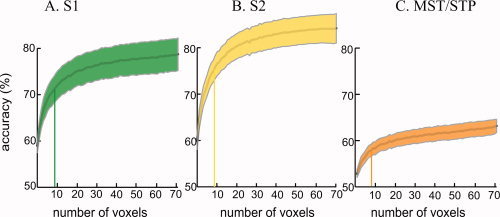
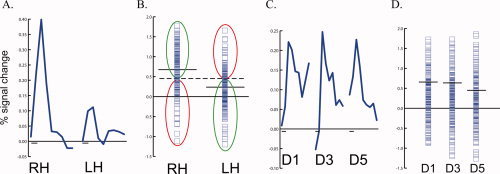
Multi-voxel pattern analysis (MVPA) was used to analyze blood-oxygen level dependent functional magnetic resonance imaging (BOLD fMRI) data, which were acquired as human subjects received brief vibrotactile stimulation of their hands and feet. Support vector machines trained and tested on the whole brain fMRI data were able to accurately decode the body site of single touches, with mean performance of 92% in a two-way discrimination task (chance performance 50%) and 70% in a four-way discrimination task (chance performance 25%). Primary and secondary somatosensory areas (S1 and S2) alone decoded the touched body site with high accuracy. S1 was more accurate at decoding touches closely spaced on the body surface (different fingers of the same hand) whereas S2 and S1 were equally accurate at decoding widely spaced touches (hand vs. foot). The hand and foot regions of S1 (S1hand and S1foot) were separately examined in a two-way classification task. S1hand was better able to decode the hand of stimulation (left vs. right), and S1foot was better able to decode the foot of stimulation. In addition to S1 and S2, vibrotactile responses were observed in a region of visual cortex, areas MST and STP (MST/STP) in lateral occipito-temporal lobe. MST/STP was able to accurately decode the hand but not the foot of stimulation, supporting the idea of a role for MST/STP in eye-hand coordination.


Figures

Figure 1
Figure 1
Methods used for somatosensory multivoxel pattern analysis. A. Somatosensory stimuli were delivered by five piezoelectric benders. In experiment 1, the benders were located on the palm of the right hand (R), the palm of the left hand (L), the sole of the right foot (D), the sole of the left foot (S), and the right hip (H). B. In experiment 2, the benders were located on the right thumb (T), the right middle finger (M), the right fifth pinky finger (P), the right hip (H), and the right foot (D). C. During the course of an MRI scan series, brain volumes were acquired (shown schematically by single brain slices) every 2 sec. Each acquisition corresponded to a single stimulation trial in which a single body site was stimulated, shown by a letter corresponding to the body plan shown in (A). Some trials (not shown) contained target bender stimulation or fixation baseline with no somatosensory stimulation. D. Using the MR data, an activation map was constructed of voxels responding significantly more (P < 10−6) to somatosensory stimulation than to fixation baseline. A lateral view of a partially inflated left hemisphere is shown, yellow color shows active areas (Argall et al.,2006). E. Over the course of a scan series, 150 brain volumes were acquired. The three black traces show the image intensity over the course of a scan series in three active voxels selected from the yellow voxels in (C). F. The time series from all active voxels (E) and the stimulus ordering (C) were used to train an N‐dimensional support vector machine. For illustration, a simplified training dataset is shown, with only two voxels and two stimulus categories (right hand and left hand). Each symbol shows the normalized MR image intensity during a single trial. The red triangles show the MR image intensity in all right hand stimulation trials and the blue triangles show the intensity in all left hand stimulation trials. The solid line shows the separating hyperplane W T X i + w 0 = 0 calculated by the classifier. The dashed lines show the margin boundaries W T X i + w 0 = ±1. Trials falling between the margin boundaries were used as support vectors (indicated by circles). An unknown test trial is classified as “right hand” if it falls below the solid line and “left hand” if it lies above the solid line. G. Result of the experiment 1 classifier when tested on a different scan series not used for training. The actual stimulus ordering presented to the subject is shown in the top row in all black, body part abbreviations as in (A). The classifier prediction of the stimulus ordering is shown in the bottom row: green for correct classification, red for incorrect classification. Performance of the classifier in this scan series was 86% correct (P < 10−38). [Color figure can be viewed in the online issue, which is available at www.interscience.wiley.com.]
Figure 2
Figure 2
Regions of interest (ROIs). Regions of interest were defined individually in each subject. Colored voxels responded significantly more to somatosensory stimulation on the hands and feet than to fixation baseline (P < 10−6). Different colors indicate different ROIs. S1 (green), primary somatosensory cortex; S1foot (blue), foot sub‐region of S1; S2 (yellow), secondary somatosensory cortex and associated areas; MST/STP (orange), areas MST and STP. [Color figure can be viewed in the online issue, which is available at www.interscience.wiley.com.]
Figure 3
Figure 3
Classification performance. A. Performance for four‐way classification (right hand, left hand, right foot, and left foot). The mean performance of the classifier when classifying single trials in a scan series not used for training, averaged across eight subjects (error bars shows the SEM). The gray bar shows the performance when the classifier was trained and tested on voxels in all ROIs; colored bars show performance when classifier was trained and tested only on voxels in a single ROI (S1, S2, MST/STP). Chance performance was 25% (dashed line). B. Accuracy of two‐way classification (left hand vs. right) in three ROIs. C. Accuracy of two‐way classification (left foot vs. right foot) in three ROIs. D. Accuracy of three‐way classification in experiment 2 (thumb vs. middle finger vs. pinky finger). [Color figure can be viewed in the online issue, which is available at www.interscience.wiley.com.]
Figure 4
Figure 4
Support vector weight maps. Map of the support vector weights (|weights|>10 colored yellow) assigned to each voxel in an ROI‐free analysis, for the same subject as shown in Figure 2. Note the high weights for voxels in S1 (left), S1foot (middle), and S2 (right). [Color figure can be viewed in the online issue, which is available at www.interscience.wiley.com.]
Figure 5
Figure 5
Relationship between region of interest size and classification performance. A. Classification accuracy for subsets of voxels from S1. Two‐way classification (left hand vs. right hand) was performed using randomly selected subsets of voxels. The y‐axis shows the classification accuracy for an ROI containing the number of voxels shown on the x‐axis. The center gray line shows the mean performance across subjects, the shaded area shows ±1 SEM across subjects (the color of the shaded area corresponds to the color used to illustrate the corresponding ROI in Fig. 2). The initial rise in the accuracy curve was fit with an exponential function. The vertical bar in each curve shows the number of voxels required to reach 75% of the peak of the exponential function. B. Classification accuracy for subsets of voxels from S2. C. Classification accuracy for subsets of voxels from MST/STP [Color figure can be viewed in the online issue, which is available at www.interscience.wiley.com.].
Figure 6
Figure 6
Classification performance with univariate analysis. A. The solid blue line shows the BOLD response averaged across all trials to right hand (RH) and left hand (LH) touch in the left hemisphere S2 of an individual subject in experiment 1. The duration of each response is 16 sec; the small black bar on the x‐axis shows the stimulus duration of 2 sec. B. Each blue symbol show the BOLD response in a single trial of right hand (RH) touch (left column of symbols) and left hand (LH) touch (right column) in left S2 (same subject as A). The solid black lines show the mean response to RH and LH touch. The optimal classification boundary is midway between the two means (dashed line). This boundary correctly classifies all RH trials above it and all LH trials below it (66%, green ellipses) and incorrectly classifies all RH trials below it and all LH trials above it (34%, red ellipses). C. The BOLD response, averaged across all trials, to thumb (D1), middle finger (D3), and pinky finger (D5) touch in the left hemisphere S2 of an individual subject in experiment 2. D. Individual trial responses (blue squares) and means (black lines) in S2 to single finger touch. [Color figure can be viewed in the online issue, which is available at www.interscience.wiley.com.]

References

    1. Amedi A,Malach R,Hendler T,Peled S,Zohary E ( 2001): Visuo‐haptic object‐related activation in the ventral visual pathway. Nat Neurosci 4: 324–330. - PubMed
    1. Argall BD,Saad ZS,Beauchamp MS ( 2006): Simplified intersubject averaging on the cortical surface using SUMA. Hum Brain Mapp 27: 14–27. - PMC - PubMed
    1. Beauchamp MS ( 2005): See me, hear me, touch me: multisensory integration in lateral occipital‐temporal cortex. Curr Opin Neurobiol 15: 145–153. - PubMed
    1. Beauchamp MS,Yasar NE,Kishan N,Ro T ( 2007): Human MST but not MT responds to tactile stimulation. J Neurosci 27: 8261–8267. - PMC - PubMed
    1. Beauchamp MS,Yasar NE,Frye RE,Ro T ( 2008): Touch, sound and vision in human superior temporal sulcus. Neuroimage 41: 1011–1020. - PMC - PubMed

Publication types

MeSH terms