. 2009 Jan;56(1):137-46.
doi: 10.1109/TBME.2008.2006013.

The role of slow potassium current in nerve conduction block induced by high-frequency biphasic electrical current

Affiliations

The role of slow potassium current in nerve conduction block induced by high-frequency biphasic electrical current

Hailong Liu et al. IEEE Trans Biomed Eng. 2009 Jan.

Abstract

The role of slow potassium current in nerve conduction block induced by high-frequency biphasic electrical current was analyzed using a lumped circuit model of a myelinated axon based on the Schwarz-Reid-Bostock model. The results indicate that nerve conduction block at stimulation frequencies above 4 kHz is due to constant activation of both fast and slow potassium channels, but the block at stimulation frequencies below 4 kHz could be due to either anodal or cathodal dc block depending on the time of the action potential arriving at the block electrode. When stimulation frequency was above 4 kHz, the slow potassium current was about 3.5 to 6.5 times greater than the fast potassium current at blocking threshold, indicating that the slow potassium current played a more dominant role than the fast potassium current. The blocking location moved from the node under the blocking electrode to a nearby node as the stimulation intensity increased. This simulation study reveals that in mammalian myelinated axons, the slow potassium current probably plays a critical role in the nerve conduction block induced by high-frequency biphasic electrical current.


Figures

Fig. 1
Fig. 1
Myelinated axonal model used to simulate conduction block induced by high-frequency biphasic electrical current. The inter-node length Δx = 100d; d is the axon diameter. L is the nodal length. Each node is modeled by a resistance-capacitance circuit based on the SRB model. Ra: inter-nodal axoplasmic resistance; Rm: nodal membrane resistance; Cm: nodal membrane capacitance; Vi, j: intracellular potential at the jth node; Ve, j: extracellular potential at the jth node.
Fig. 2
Fig. 2
Propagation of action potentials along an axon induced by high-frequency biphasic stimulation at different intensities. The short arrows mark the locations of test and block electrodes along the axon in each figure. Stimulation: 7 kHz. Axon diameter: 5 μm.
Fig. 3
Fig. 3
Pattern of nerve block and repetitive firing at different stimulation frequencies and intensities for axons of different diameters. The dark areas represent the stimulation intensity ranges causing nerve block as shown in Fig. 2B or D. The hatched areas represent repetitive firing as shown in Fig. 2C. The white areas represent nerve conduction block failure as shown in Fig. 2A.
Fig. 4
Fig. 4
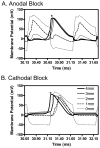
Propagation of membrane potentials near the block electrode when anodal (A) or cathodal (B) block occurs. The legend in B indicates the distance from the block electrode for both A and B. The thinnest dashed line (0 mm) corresponds to the node under the block electrode (i.e. at 30 mm location). The thickest solid line (4 mm) corresponds to the node 4 mm away from the block electrode (i.e. at 26 mm location). The anodal block (A) occurred at 1 mA stimulation intensity for a 10 μm axon. The cathodal block (B) occurred at 1.6 mA stimulation intensity for a 5 μm axon. Stimulation frequency: 1 kHz. The asterisks mark the propagating action potential from the test electrode.
Fig. 5
Fig. 5
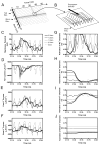
Propagation of membrane potential, ionic current, and activation/inactivation of ion channels near the block electrode when potassium block occurs. The legend in C indicates the distance from the block electrode (0 mm is under the block electrode). The propagation of membrane potential near the block electrode is shown in detail in B. Stimulation: intensity 2.2 mA, frequency 7 kHz. Axon diameter: 5 μm. The asterisks in C–F mark the propagating action potential from the test electrode, and its corresponding ionic currents.
Fig. 6
Fig. 6
Block locations and activating functions at 2.2 mA (A) and 8 mA (B) stimulation intensities. The upper trace showing the membrane potentials at different nodes shares the same horizontal axis as the lower trace showing the activating functions. The block electrode is located at 30 mm. The activating function for both anodal and cathodal pulses are shown. A: Nerve conduction was blocked at the node under the block electrode. B: The block occurred at the node 2 mm away (at 28 mm) from the block electrode. Stimulation frequency: 7 kHz. Axon diameter: 5 μm.
Fig. 7
Fig. 7
Activation of fast (n, in A and B) and slow (s, in C and D) potassium channels at different stimulation frequencies (A and C) and intensities (B and D) for the node under the block electrode. In A and C, the stimulation intensity is 2 mA. In B and D, the stimulation frequency is 7 kHz. The parameters in the legend enclosed by a square box are above the blocking threshold. Axon diameter: 5 μm.
Fig. 8
Fig. 8
Activation of fast (n, in A and B) and slow (s, in C and D) potassium channels at different stimulation frequencies (A and C) and intensities (B and D) for the node under the block electrode. In A and C, the stimulation intensity is 1 mA. In B and D, the stimulation frequency is 7 kHz. The parameters in the legend enclosed by a square box are above the blocking threshold. Axon diameter: 20 μm.
Fig. 9
Fig. 9
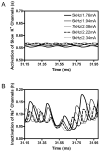
Activation of slow potassium channels (A) and inactivation of sodium channels (B) at the node under the block electrode for different blocking thresholds. The legend in A shows the intensity thresholds at different frequencies. Axon diameter: 5 μm.
Fig. 10
Fig. 10
Contribution of fast (n) and slow (s) potassium currents to nerve conduction block at the blocking threshold level. The single solid line represents the n4. The double solid lines indicate the range of fast potassium activation at blocking thresholds and the corresponding range for n4. The single dashed line represents the 2s. The double dashed lines indicate the range of slow potassium activation at blocking thresholds and the corresponding range for 2s. At blocking thresholds, 2s/n4 is about 3.5 to 6.5 indicating that slow potassium current is more dominant than fast potassium current. Axon diameter: 5 μm.

References

    1. Nashold B, Goldner J, Mullen J, Bright D. Long-term pain control by direct peripheral-nerve stimulation. J Bone Joint Surg. 1982;64(1):1–10. - PubMed
    1. Kilgore K, Bhadra N. Nerve conduction block utilising high-frequency alternating current. Med Biol Eng Comput. 2004 May;42(3):394–406. - PubMed
    1. Tai C, Roppolo J, de Groat W. Block of external urethral sphincter contraction by high frequency electrical stimulation of pudendal nerve. J Urol. 2004;172(5):2069–2072. - PubMed
    1. Agnew W, McCreery D, editors. Prentice Hall Advanced Reference Series. Prentice Hall Biophysics and Bioengineering Series; Englewood Cliffs (New Jersey): 1990. Neural prostheses: Fundamental studies, ser.
    1. Bhadra N, Bhadra N, Kilgore K, Gustafson K. High frequency electrical conduction block of pudendal nerve. J Neural Eng. 2006 Jun;3(2):180–187. - PMC - PubMed

Publication types