. 2009 Feb 17;2(58):ra6.
doi: 10.1126/scisignal.2000021.

The precise sequence of FGF receptor autophosphorylation is kinetically driven and is disrupted by oncogenic mutations

Affiliations

The precise sequence of FGF receptor autophosphorylation is kinetically driven and is disrupted by oncogenic mutations

Erin D Lew et al. Sci Signal. .

Abstract

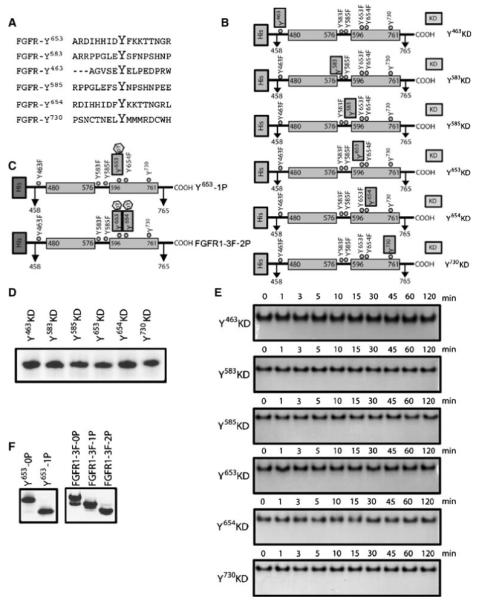
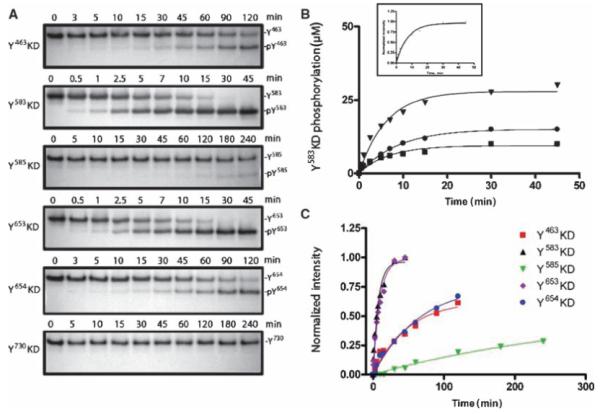
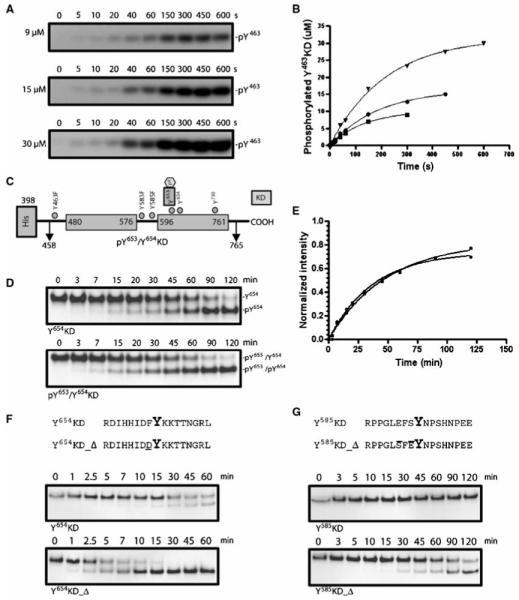
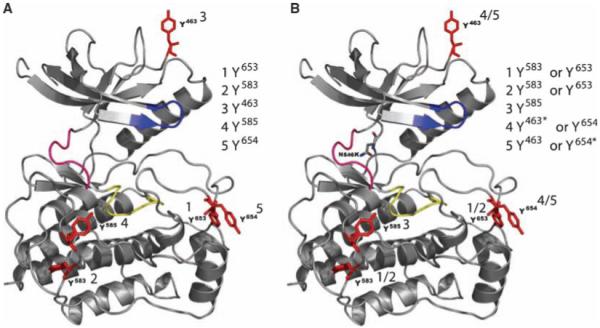
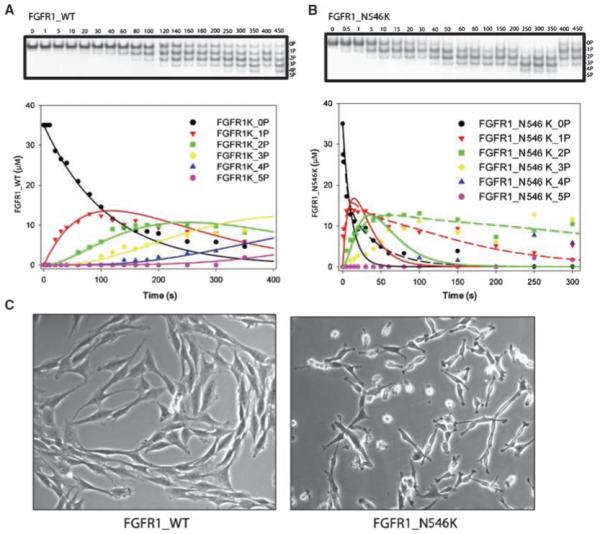
Autophosphorylation of the tyrosine kinase domain of fibroblast growth factor receptor 1 (FGFR1) is mediated by a sequential and precisely ordered three-stage autophosphorylation reaction. First-stage autophosphorylation of an activation loop tyrosine leads to 50- to 100-fold stimulation of kinase activity and is followed by second-stage phosphorylation of three additional tyrosine residues, which are binding sites for signaling molecules. Finally, third-stage phosphorylation of a second activation loop tyrosine leads to an additional 10-fold stimulation of FGFR1 catalytic activity. In this report, we show that sequential autophosphorylation of five tyrosines in the FGFR1 kinase domain is under kinetic control, mediated by both the amino acid sequence surrounding the tyrosines and their locations within the kinase structure, and, moreover, that phosphoryl transfer is the rate-limiting step. Furthermore, the strict order of autophosphorylation is disrupted by a glioblastoma-derived, oncogenic FGFR1 point mutation in the kinase domain. We propose that disrupted stepwise activation of tyrosine autophosphorylation caused by oncogenic and other activating FGFR mutations may lead to aberrant activation of and assembly of signaling molecules by the activated receptor.


Figures

Fig. 1
Fig. 1
Amino acid alignment of tyrosine phosphorylation sites and overview of FGFR1 kinase constructs. (A) Aminoacid alignment of FGFR1 tyrosine kinase autophosphorylation sites according to the observed order of phosphorylation. Phosphorylation of Y730 was not observed in this system. (B) Diagram of His-tagged, kinase-dead FGFR1 substrates, each with a single tyrosine phosphorylation site as indicated by the construct number. In the first five substrates, four other tyrosines are mutated to phenylalanine, and in the Y730KD construct, five tyrosines are mutated to phenylalanine as indicated by a Y→F mutation. Constructs were made kinase-dead by mutation of the catalytic base, D623A. (C) A schematic diagram of FGFR1 kinase-active domains used for phosphorylation of the kinase-dead substrates. The monophosphorylated form (Y653-1P) is phosphorylated at Y653 and the bis-phosphorylated form (FGFR-3F-2P) is phosphorylated at both Y653 and Y654. (D) Native gel electrophoresis of purified FGFR1 kinase-dead substrates. (E) Kinase assay of FGFR1 kinase-dead substrates. The different substrates (30 μM final concentration) were incubated at 25°C with ATP and MgCl2 to a final concentration of 5 and 10 mM, respectively. The reaction was quenched at different reaction times with 50 mM EDTA, final. Reaction samples were separated by native gel electrophoresis to observe the formation of phosphorylated species. Autophosphorylation of the kinase-dead samples was not observed. (F) Native gel electrophoresis of purified FGFR kinase-active domains in either a monophosphorylated (Y653-1P) or a bis-phosphorylated (FGFR1-3F-2P) state as shown by the gel shift.
Fig. 2
Fig. 2
Quantitative analysis of phosphorylation of individual FGFR1 kinase domain tyrosine sites. (A) Phosphorylation of FGFR1 kinase-dead substrates by fully activated FGFR1 kinase. FGFR1-3F-2P (0.1 μM) was reacted with saturating concentration of FGFR1 kinase-dead substrate (10 μM shown), 5 mM ATP, and 10 mM MgCl2 at 25°C for various amounts of time. Reactions were quenched upon addition of 50 mM EDTA and the phosphorylation states of the kinase-dead substrate at each time point separated by native gel electrophoresis. The amount of active kinase is below the limit of detection and cannot be seen on the gels. (B) Representative quantitative analysis of FGFR1-3F-2P-mediated phosphorylation of Y583KD substrate at three saturating concentrations of substrate: (■) 10 μM (reaction rate, 0.1523 min-1), (●) 15 μM (reaction rate, 0.1139 min-1), and (▼) 30 μM (reaction rate, 0.1628 min-1). Data at the three concentrations were similar and averaged (inset). (C) Quantitative comparison of FGFR1-3F-2P-mediated phosphorylation of the five kinase-dead substrates. Shown is the average of the data obtained from the three saturating concentrations of each substrate. Calculated average rates of phosphorylation are as follows: (■, red) Y463KD, 0.0209 ± 0.004 min-1; (▲, black) Y583KD, 0.1388 ± 0.016 min-1; (▼, green) Y585KD, 0.0032 ± 0.001 min-1; (◆, purple) Y653KD, 0.1080 ± 0.010 min-1; and (●, blue) Y654KD, 0.0151 ± 0.002 min-1. Data were fit to a single-exponential equation in Graphpad.
Fig. 3
Fig. 3
Kinetic regulation of FGFR1 autophosphorylation. (A) Phosphorylation of kinase-dead substrate by fully activated kinase. FGFR1-3F-2P kinase (3 μM) was incubated with 3-fold (9 μM), 5-fold (15 μM), and 10-fold (30 μM) excess Y463KD substrate in the presence of 5 mM [γ-32P]ATP and 10 mM MgCl2 in a rapid chemical quench apparatus. The formation of the monophosphorylated species over time was followed by incorporation of radiolabeled phosphate. (B) Quantitative analysis of Y463KD phosphorylation by FGFR1-3F-2P kinase. The data were fit in Graphpad to a single-exponential equation and did not converge to the burst equation. Reaction rates for 3- (■), 5- (●), and 10-fold (▼) excess substrate were 0.007 ± 0.0004, 0.005 ± 0.0003, and 0.004 ± 0.0003 s-1, respectively. (C) Schematic of pY653/Y654 KD substrate phosphorylated at Y653 with Y654 site unphosphorylated. The other three tyrosine sites are mutated to phenylalanine. (D) Phosphorylation of kinase-dead substrates Y654KD and pY653/Y654 by fully activated kinase FGFR1-3F-2P. FGFR1-3F-2P (0.1 μM) was reacted with saturating concentration of FGFR1 kinase-dead substrate (30 μM), 5 mM ATP, and 10 mM MgCl2 for various amounts of time. Reactions were quenched with 50 mM EDTA and the phosphorylation states of the kinase-dead substrate at each time point were separated by native gel electrophoresis. The amount of the active kinase is below the limit of detection and cannot be seen on the gels. (E) Quantitative analysis of FGFR1-3F-2P-mediated phosphorylation of pY653/Y654KD and Y654KD. Shown are the average data obtained from two saturating concentrations of substrate: 15 and 30 μM. Y654KD (■) and pY653/Y654KD (●) were phosphorylated at a rate of 0.0209 ± 0.001 and 0.0271 ± 0.002 min-1, respectively. (F) Phosphorylation of kinase-dead substrates Y654KD and Y654KD_Δ (containing a Y653D point mutation) by fully activated kinase FGFR1-3F-2P. FGFR1-3F-2P (0.1 μM) was reacted with saturating concentration of FGFR1 kinase-dead substrate (30 μM), 5 mM ATP, and 10 mM MgCl2 for various amounts of time. Reactions were quenched with 50 mM EDTA, and phosphorylated and unphosphorylated forms of kinase-dead substrate at each time point were separated by native gel electrophoresis. (G) Phosphorylation of kinase-dead substrates Y585KD and Y585KD_Δ (with Y - 1 position of Y583 and Y585 swapped) by fully activated kinase FGFR1-3F-2P. FGFR1-3F-2P (0.1 μM) was reacted with saturating concentration of FGFR1 kinase-dead substrate (30 μM), 5 mM ATP, and 10 mM MgCl2 for various amounts of time. Reactions were quenched with 50 mM EDTA and phosphorylated and unphosphorylated forms of the kinase-dead substrate at each time point were separated by native gel electrophoresis. In both cases, the amount of active kinase is below the limit of detection and cannot be seen on the gels.
Fig. 4
Fig. 4
Molecular model of FGFR1 mutation implicated in glioblastoma, depicting order of autophosphorylation. The nucleotide binding pocket is shown in blue, the hinge region in magenta, and the catalytic cleft in yellow. The tyrosine phosphorylation sites are depicted and high-lighted in red. The observed order of autophosphorylation obtained by rapid chemical quench and subsequent LC/ESI-MS/MS is indicated. For the FGFR1 glioblastoma mutants, heterogeneous phosphorylation was observed at the fourth and fifth sites, but the intensity of the peptide peaks by LC/ESI-MS/MS suggests that the site indicated by a star was the preferred phosphorylation site. (A) FGFR1 kinase wild type (WT). (B) Glioblastoma-derived FGFR1_N546K mutation is found near the hinge region of FGFR1 kinase and is indicated on the structure.
Fig. 5
Fig. 5
Effect of glioblastoma-derived N546K mutation on FGFR1 autophosphorylation and cell signaling. Wild-type FGFR1 (FGFR1_WT) and FGFR1 harboring an N546K point mutation (35 μM) were reacted with 5 mM ATP and 10 mM MgCl2 in a rapid chemical quench apparatus and quenched by addition of 83 mM EDTA. The different phosphorylation states at each time point were separated by native PAGE. The kinetic parameters are summarized in table S1. (A) Native-PAGE and kinetic analysis of wild-type FGFR1 autophosphorylation. (B) Native PAGE and kinetic analysis of FGFR1K_N546K autophosphorylation. As illustrated by the solid line fit, the data did not fit well with the monophasic mechanism used to describe the kinetics of wildtype FGFR1. Rather, a biphasic mechanism (dashed line) was required to accommodate and best describe the phosphorylation kinetics of this mutant. (C) Rat-1 cells stably expressing either wild-type FGFR1 or a glioblastoma-derived FGFR1_N546K mutant.

Similar articles

Cited by

References

    1. Furdui CM, Lew ED, Schlessinger J, Anderson KS. Autophosphorylation of FGFR1 kinase is mediated by a sequential and precisely ordered reaction. Mol. Cell. 2006;21:711–717. - PubMed
    1. Abbreviations for the amino acid residues are as follows:Ala A, Cys C, Asp D, Glu E, Phe F, Gly G, His H, Ile I, Lys K, Leu L, Met M, Asn N, Pro P, Gln Q, Arg R, Ser S, Thr T, Val V, Trp W, Tyr Y. X represents any amino acid.

    1. Dickens M, Tavaré JM. Analysis of the order of autophosphorylation of human insulin receptor tyrosines 1158, 1162 and 1163. Biochem. Biophys. Res. Commun. 1992;186:244–250. - PubMed
    1. Wei L, Hubbard SR, Hendrickson WA, Ellis L. Expression, characterization, and crystallization of the catalytic core of the human insulin receptor protein-tyrosine kinase domain. J. Biol. Chem. 1995;270:8122–8130. - PubMed
    1. Favelyukis S, Till JH, Hubbard SR, Miller WT. Structure and autoregulation of the insulin-like growth factor 1 receptor kinase. Nat. Struct. Biol. 2001;8:1058–1063. - PubMed

Substances