. 2009 Apr 3;284(14):9372-81.
doi: 10.1074/jbc.M809457200. Epub 2009 Feb 18.

Saposin B-dependent reconstitution of arylsulfatase A activity in vitro and in cell culture models of metachromatic leukodystrophy

Affiliations

Saposin B-dependent reconstitution of arylsulfatase A activity in vitro and in cell culture models of metachromatic leukodystrophy

Ulrich Matzner et al. J Biol Chem. .

Abstract

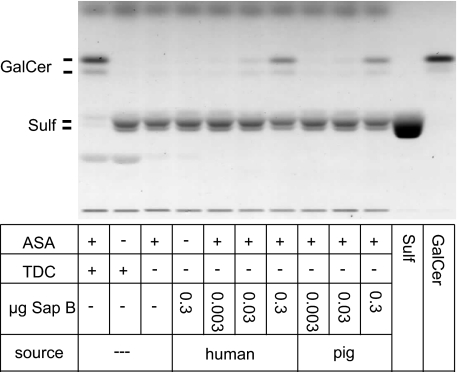
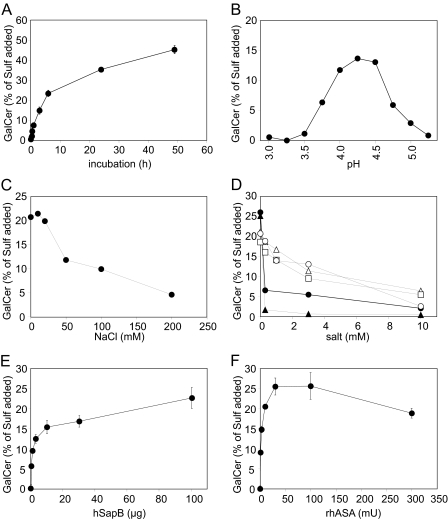
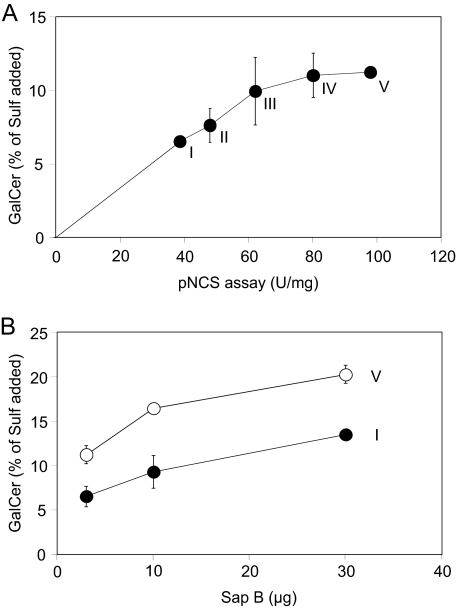
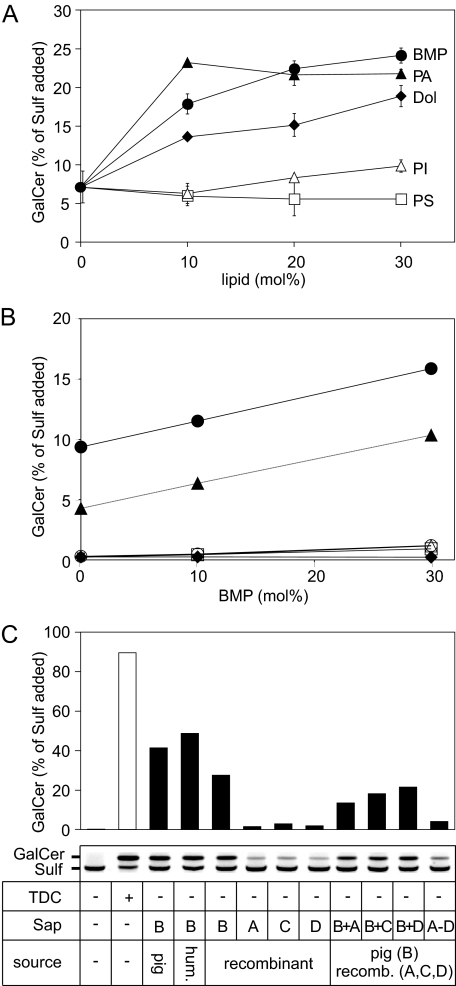
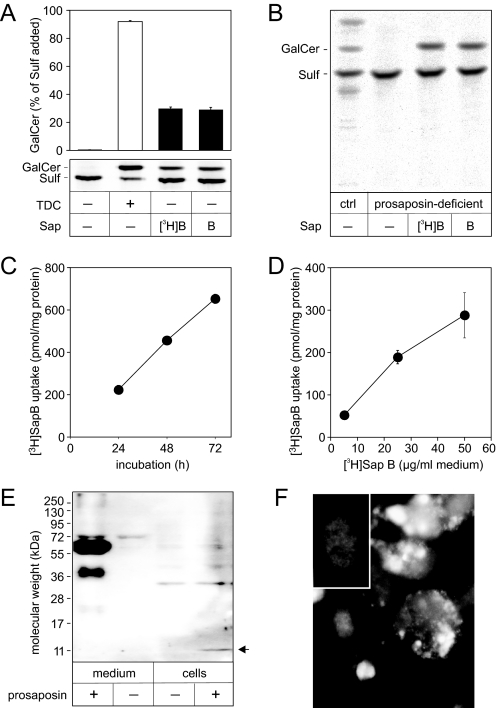
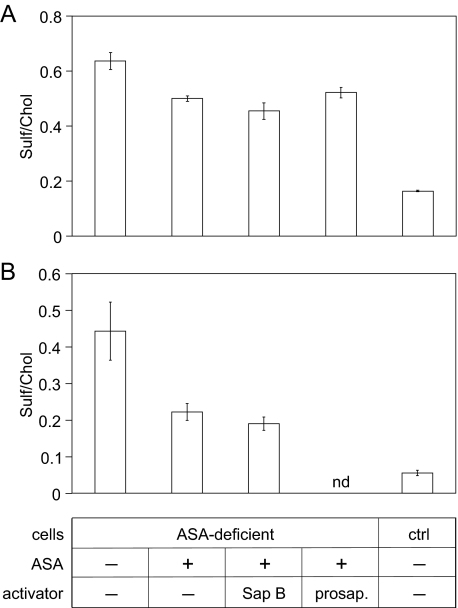
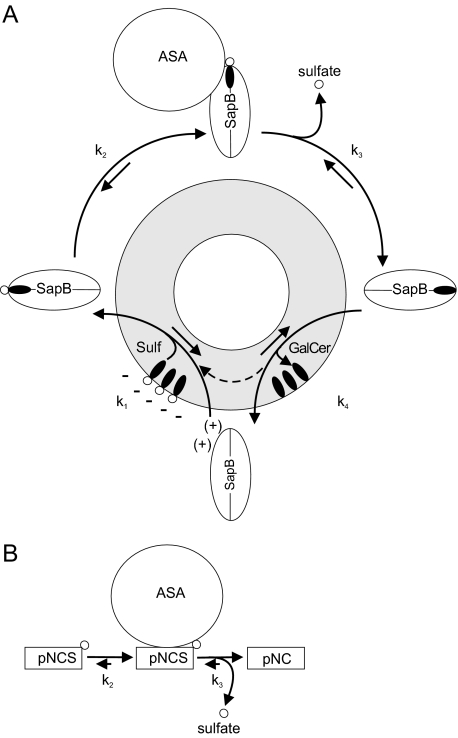
Arylsulfatase A (ASA) catalyzes the intralysosomal desulfation of 3-O-sulfogalactosylceramide (sulfatide) to galactosylceramide. The reaction requires saposin B (Sap B), a non-enzymatic proteinaceous cofactor which presents sulfatide to the catalytic site of ASA. The lack of either ASA or Sap B results in a block of sulfatide degradation, progressive intralysosomal accumulation of sulfatide, and the fatal lysosomal storage disease metachromatic leukodystrophy. We studied the coupled Sap B-ASA reaction in vitro using detergent-free micellar and liposomal assay systems and in vivo using cell culture models of metachromatic leukodystrophy. Under in vitro conditions, the reaction had a narrow pH optimum around pH 4.3 and was inhibited by mono- and divalent cations, phosphate and sulfite. Bis(monoacylglycero) phosphate and phosphatidic acid were activators of the reaction, underscoring a significant role of acidic phosphoglycerolipids in sphingolipid degradation. Desulfation was negligible when Sap B was substituted by Sap A, C, or D. Up to a molar ratio between Sap B and sulfatide of 1:5, an elevation of Sap B concentrations caused a sharp increase of sulfatide hydrolysis, indicating the requirement of unexpected high Sap B levels for maximum turnover. Feeding of ASA-deficient, sulfatide-storing primary mouse kidney cells with ASA caused partial clearance of sulfatide. Co-feeding of Sap B or its precursor prosaposin resulted in the lysosomal uptake of the cofactor but did not promote ASA-catalyzed sulfatide hydrolysis. This suggests that Sap B is not a limiting factor of the coupled Sap B-ASA reaction in mouse kidney cells even if sulfatide has accumulated to unphysiologically high levels.


Figures

FIGURE 1.
FIGURE 1.
Sap B-dependent hydrolysis of sulfatide in a non-radioactive assay using pure sulfatide micelles as a substrate. Micelles were incubated with 40 milliunits of rhASA and increasing concentrations of human or porcine Sap B for 4 h. Lipids were separated by high performance TLC. For a positive control, Sap B was substituted by taurodeoxycholate (TDC). For a negative control, reactions were conducted without ASA or without detergent and Sap B.
FIGURE 2.
FIGURE 2.
Sulfatide hydrolysis under different experimental conditions using liposomes containing 10 mol % sulfatide, 10 mol % cholesterol, and 80 mol % phosphatidylcholine as a substrate. Unless otherwise indicated, the reaction conditions were 10 mm NaAc, pH 4.5, 30 milliunits of rhASA, 5 nmol of sulfatide, and 0.3 nmol of Sap B. Either 20 mm NaCl (B) or no NaCl (A, D–F) was added. Reaction times were 4 h (B–D, F) or 2 h (E). Experiments shown in B–D were done in single assays. Data points and bars shown in A, E, and F represent the means ± S.D. of n = 3 independent experiments per condition. Please note that in some cases error bars are hidden by the symbols. Shown are variation of incubation time (A), pH value (B), NaCl concentration (C), concentration of MgCl2 (open triangles), CaCl2 (open squares), MnCl2 (open circles), NaH2PO4 (closed circles), and Na2SO3 (closed triangles) (E), concentration of native human Sap B (D), and activity of rhASA (F).
FIGURE 3.
FIGURE 3.
Activities of five different rhASA preparations (I–V) purified from secretions of Chinese hamster ovary cells. The activities were measured in a cofactor-independent assay using the water-soluble substrate pNCS (21) and in a Sap B-dependent assay using pure sulfatide micelles as a substrate. For the sulfatide hydrolyzing activity, the means ± S.D. of n = 3 independent measurements are indicated. A, correlation between pNCS hydrolytic activity (abscissa) and sulfatide hydrolytic activity (ordinate). B, effect of increasing concentrations of native human Sap B on sulfatide hydrolyzing activity of preparation I and V.
FIGURE 4.
FIGURE 4.
Effect of acidic lipids and saposin A, C, and D on sulfatide hydrolysis. A, stimulatory effects of different lipid additives. Liposomes composed of 10 mol % of sulfatide, 10 mol % of cholesterol, and 80–50 mol % of phosphatidylcholine were mixed with 0–30 mol % of one of the following lipids: BMP (closed circles;), phosphatidic acid (closed triangles, PA), dolichol (closed diamonds, dol), phosphatidylinositol (open triangles, PI), phosphatidylserine (open squares, PS). Reaction conditions are as outlined in the legend of Fig. 2. For each condition the mean ± S.D. of n = 3 independent measurements are indicated. B, saposin- and BMP-dependent sulfatide hydrolysis. Liposomes consisting of 10 mol % [14C]sulfatide, 10 mol % cholesterol, 0–30 mol % BMP, and 80–50 mol % phosphatidylcholine were reacted in the presence of one of the following Saps (0.3 nmol): native human Sap B (closed circles), native porcine Sap B (closed triangles), recombinant human Sap A (open circles), recombinant human Sap C (open triangles), recombinant human Sap D (open squares). As a negative control, no Sap was added (closed diamonds). The graphs for the negative control, Sap A, C, and D are hardly discernible due to substantial overlap close to the base line. Data are from single assays. C, saposin-dependent sulfatide hydrolysis in pure sulfatide micelles containing [14C]sulfatide. Different Saps were added alone or in combination as indicated. After TLC, radioactive Sulf and GalCer was visualized (inset) and densitometrically quantified (histogram). The histogram bar upper limits represent the means of two independent experiments. TDC, taurodeoxycholate.
FIGURE 5.
FIGURE 5.
Cellular uptake of [3H]Sap B and prosaposin. A, activity of [3H]Sap B tested by hydrolysis of [14C]sulfatide in a liposomal in vitro assay under standard conditions. Lipids were separated by TLC and quantified. Bars representing the means ± S.E. of n = 2 independent measurements are indicated. B, effect of [3H]Sap B and native Sap B on the degradation of [14C]sulfatide in prosaposin-deficient and healthy control (ctrl) fibroblasts. Cells were preincubated for 24 h with Sap B (25 μg/ml medium) and subsequently fed additionally with [14C]sulfatide (0.66 nmol/ml medium) for 48 h. Cellular lipids were separated by TLC and 14C-labeled compounds were visualized by autoradiography. C, uptake of [3H]Sap B by prosaposin-deficient human fibroblasts. Cells were incubated with [3H]Sap B (25 μg/ml) for 24, 48, and 72 h. The means ± S.E. of n = 2 independent experiments are indicated. D, uptake of [3H]Sap B by ASA-deficient murine kidney cells. Cells were incubated with different concentrations of [3H]Sap B for 24 h. The means ± S.E. of n = 3 independent experiments are indicated. E, prosaposin and Sap C in media and homogenates of ASA-deficient murine kidney cells fed with human prosaposin (2 μg/ml medium). An antiserum which specifically recognizes human prosaposin and human Sap C (arrow) was used for immunodetection. F, immunofluorescence staining of human Sap C in cells incubated with 2 μg/ml human prosaposin for 24 h. Cell nuclei were counterstained with 4′,6-diamidino-2-phenylindole and appear diffuse gray in the black-and-white image. Bright signals for Sap C are mainly detectable in the perinuclear region. Signals are absent from cells which were cultured without human prosaposin (inset).
FIGURE 6.
FIGURE 6.
Effect of Sap B and prosaposin co-feeding on sulfatide storage reduction in primary murine ASA-deficient kidney cells incubated with rhASA. Wild type primary kidney cells were used as a control (ctrl). Sulfatide levels were normalized on cholesterol (chol) levels. Bars indicate the means ± S.D. of n = 3 experiments per condition. nd, not determined. A, cells were treated with 2.5 μg/ml rhASA and 25 μg/ml native human Sap B or 2 μg/ml prosaposin as indicated in the table below (B). After 24 h cells were harvested for lipid analysis. B, sulfatide levels of cells after treatment with 6 μg/ml rhASA and 4.5 μg/ml native human Sap B for 48 h.
FIGURE 7.
FIGURE 7.
Kinetic models of ASA-catalyzed reactions. A, kinetic model of the coupled Sap B-ASA reaction. The reaction involves binding of Sap B to the lysosomal target membrane and extraction of membrane-bound sulfatide (k1). The sensitivity of the mobilization process to anionic lipids, pH value, and ionic strength (12) suggests that the Sap B-membrane interaction is based on weak ionic attraction of the negatively charged membrane surface and Sap B, which, due to its isoelectric point close to the lysosomal pH, has only a small positive net charge. Anionic lipids, particularly BMP, might facilitate sulfatide extraction by providing negative surface charges and perturbing the membrane structure. The mobilized sulfatide is recognized by ASA (k2) and hydrolyzed to galactosylceramide and sulfate (k3). Galactosylceramide is then released from the lipid binding site of Sap B (k4), allowing another round of the reaction cycle. The requirement of high concentrations of Sap B for maximum hydrolysis suggests that the product-substrate exchange (determined by k4 and k1) is the rate-limiting step of the coupled Sap B-ASA reaction. B, kinetic model of ASA-catalyzed hydrolysis of the sulfate ester pNCS. This artificial substrate is conventionally used to measure ASA activity. Under standard conditions ASA molecules are saturated by an excess of pNCS, and the catalytic rate of ASA (k3) is rate-limiting.

References

    1. Sandhoff, K., and Kolter, T. (2003) Philos. Trans. R. Soc. Lond. B. Biol. Sci. 358 847-861 - PMC - PubMed
    1. Kolter, T., and Sandhoff, K. (2005) Annu. Rev. Cell Dev. Biol. 21 81-103 - PubMed
    1. Sandhoff, K., Kolter, T., and Harzer, K. (2001) in The Metabolic and Molecular Basis of Inherited Disease (Scriver, C. R., Beaudet, A. L., Sly, W. S., and Valle, D., eds) pp. 3371-3388, McGraw-Hill, New York
    1. Kishimoto, Y., Hiraiwa, M., and O'Brien, J. S. (1992) J. Lipid Res. 33 1255-1267 - PubMed
    1. Fujita, N., Suzuki, K., Vanier, M. T., Popko, B., Maeda, N., Klein, A., Henseler, M., Sandhoff, K., Nakayasu, H., and Suzuki, K. (1996) Hum. Mol. Genet. 5 711-725 - PubMed

Publication types