Effect of cholesterol on the structure of a phospholipid bilayer
- PMID: 19225105
- PMCID: PMC2656135
- DOI: 10.1073/pnas.0809959106
Effect of cholesterol on the structure of a phospholipid bilayer
Abstract
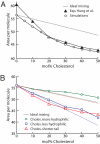
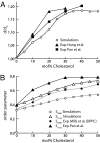
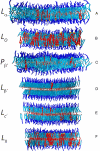
Cholesterol plays an important role in regulating the properties of phospholipid membranes. To obtain a detailed understanding of the lipid-cholesterol interactions, we have developed a mesoscopic water-lipid-cholesterol model. In this model, we take into account the hydrophobic-hydrophilic interactions and the structure of the molecules. We compute the phase diagram of dimyristoylphosphatidylcholine-cholesterol by using dissipative particle dynamics and show that our model predicts many of the different phases that have been observed experimentally. In quantitative agreement with experimental data our model also shows the condensation effect; upon the addition of cholesterol, the area per lipid decreases more than one would expect from ideal mixing. Our calculations show that this effect is maximal close to the main-phase transition temperature, the lowest temperature for which the membrane is in the liquid phase, and is directly related to the increase of this main-phase transition temperature upon addition of cholesterol. We demonstrate that no condensation is observed if we slightly change the structure of the cholesterol molecule by adding an extra hydrophilic head group or if we decrease the size of the hydrophobic part of cholesterol.
Conflict of interest statement
The authors declare no conflict of interest.
Figures


Similar articles
-
Molecular simulation of the DMPC-cholesterol phase diagram.J Phys Chem B. 2010 Aug 19;114(32):10451-61. doi: 10.1021/jp103903s. J Phys Chem B. 2010. PMID: 20662483
-
Comparative molecular dynamics study of lipid membranes containing cholesterol and ergosterol.Biophys J. 2006 Apr 1;90(7):2368-82. doi: 10.1529/biophysj.105.072801. Epub 2006 Jan 6. Biophys J. 2006. PMID: 16399829 Free PMC article.
-
Simulation studies of protein-induced bilayer deformations, and lipid-induced protein tilting, on a mesoscopic model for lipid bilayers with embedded proteins.Biophys J. 2005 Mar;88(3):1778-98. doi: 10.1529/biophysj.104.050849. Biophys J. 2005. PMID: 15738466 Free PMC article.
-
Condensed complexes of cholesterol and phospholipids.Biochim Biophys Acta. 2003 Mar 10;1610(2):159-73. doi: 10.1016/s0005-2736(03)00015-4. Biochim Biophys Acta. 2003. PMID: 12648771 Review.
-
Membrane simulations: bigger and better?Curr Opin Struct Biol. 2000 Apr;10(2):174-81. doi: 10.1016/s0959-440x(00)00066-x. Curr Opin Struct Biol. 2000. PMID: 10753807 Review.
Cited by
-
Effects of osmotic pressure on the irreversible electroporation in giant lipid vesicles.PLoS One. 2021 May 14;16(5):e0251690. doi: 10.1371/journal.pone.0251690. eCollection 2021. PLoS One. 2021. PMID: 33989363 Free PMC article.
-
Problems of human spermatozoa cryopreservation: research methods, solutions.Biophys Rev. 2023 Oct 4;15(5):1223-1232. doi: 10.1007/s12551-023-01133-x. eCollection 2023 Oct. Biophys Rev. 2023. PMID: 37975014 Free PMC article. Review.
-
Recent developments in the kinetics of ruptures of giant vesicles under constant tension.RSC Adv. 2021 Sep 2;11(47):29598-29619. doi: 10.1039/d1ra04647k. eCollection 2021 Sep 1. RSC Adv. 2021. PMID: 35479542 Free PMC article. Review.
-
Kinetics of Histidine-Tagged Protein Association to Nickel-Decorated Liposome Surfaces.Langmuir. 2019 Sep 24;35(38):12550-12561. doi: 10.1021/acs.langmuir.9b01700. Epub 2019 Sep 9. Langmuir. 2019. PMID: 31466440 Free PMC article.
-
The Effect of the Synthesis Method on Physicochemical Properties of Selective Granular Polymer Sorbents.Polymers (Basel). 2022 Jan 17;14(2):353. doi: 10.3390/polym14020353. Polymers (Basel). 2022. PMID: 35054763 Free PMC article.
References
-
- Leathes JB. Croonian lectures on the role of fats in vital phenomena. The Lancet. 1925;205:853–856.
-
- Ikonen E. Cellular cholesterol trafficking and compartmentalization. Nat Rev Mol Cell Biol. 2008;9:125–138. - PubMed
-
- McConnell HM, Radhakrishnan A. Condensed complexes of cholesterol and phospholipids. Biochim Biophys Acta Biomembr. 2003;1610:159–173. - PubMed
MeSH terms
Substances
LinkOut - more resources
Full Text Sources
Other Literature Sources
Medical

