. 2009 Apr;20(7):2004-14.
doi: 10.1091/mbc.e08-12-1250. Epub 2009 Feb 18.

An Atg1/Atg13 complex with multiple roles in TOR-mediated autophagy regulation

Affiliations

An Atg1/Atg13 complex with multiple roles in TOR-mediated autophagy regulation

Yu-Yun Chang et al. Mol Biol Cell. 2009 Apr.

Abstract

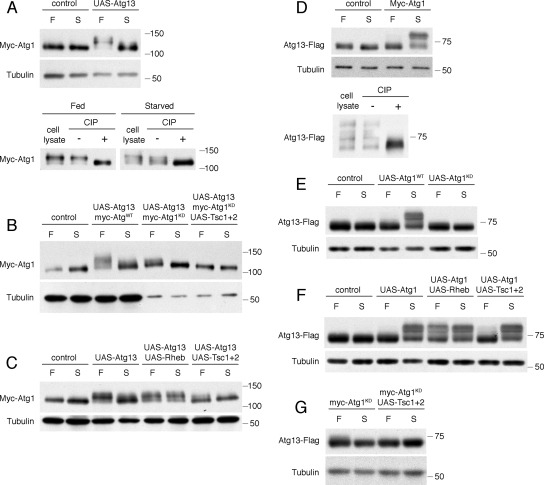
The TOR kinases are conserved negative regulators of autophagy in response to nutrient conditions, but the signaling mechanisms are poorly understood. Here we describe a complex containing the protein kinase Atg1 and the phosphoprotein Atg13 that functions as a critical component of this regulation in Drosophila. We show that knockout of Atg1 or Atg13 results in a similar, selective defect in autophagy in response to TOR inactivation. Atg1 physically interacts with TOR and Atg13 in vivo, and both Atg1 and Atg13 are phosphorylated in a nutrient-, TOR- and Atg1 kinase-dependent manner. In contrast to yeast, phosphorylation of Atg13 is greatest under autophagic conditions and does not preclude Atg1-Atg13 association. Atg13 stimulates both the autophagic activity of Atg1 and its inhibition of cell growth and TOR signaling, in part by disrupting the normal trafficking of TOR. In contrast to the effects of normal Atg13 levels, increased expression of Atg13 inhibits autophagosome expansion and recruitment of Atg8/LC3, potentially by decreasing the stability of Atg1 and facilitating its inhibitory phosphorylation by TOR. Atg1-Atg13 complexes thus function at multiple levels to mediate and adjust nutrient-dependent autophagic signaling.


Figures

Figure 1.
Figure 1.
Generation of mutations in Drosophila Atg13. (A) Amino acid sequence alignment of the C-terminal region of Atg13 orthologues from yeast, human (KIAA0652) and fly (CG7331). Identical residues are boxed. Asterisks indicate the extent of the Δ81 deletion. (B) Schematic showing the extent and orientation of the Δ74 and Δ81 deletions relative to the Atg13 transcript and the P element GS11822. The dashed line indicates sequences used to generate the inverted repeat RNAi construct 7331-R1. (C) Genomic DNA from larvae homozygous or heterozygous for Atg13 deletions Δ74 and Δ81 was analyzed by PCR using the primers indicated by arrows in B. A 1720-base pair fragment is amplified from wild-type and heterozygous samples. Animals carrying the Δ74 allele generate a smaller (1474 base pairs) product, whereas those carrying the Δ81 allele generate a 3.3-kb product, reflecting both a 2.2-kb remnant of the excised P element and a 593-base pair deletion of genomic DNA, as determined by sequence analysis.
Figure 2.
Figure 2.
Atg13 is required for starvation-induced autophagy downstream of TOR. (A) Atg13 mutant cells are defective for 4-h starvation-induced autophagy. Shown is a mosaic fat body tissue comprised of clones of Atg13−/− cells (GFP-negative) and heterozygous control cells (GFP-positive); all cells express mCherry-Atg8a as a marker for autophagic vesicles (autophagosomes and autolysosomes), which appear as punctate structures in control cells. (B) Generation of acidified autolysosomes in response to 4-h starvation is defective in clones of Atg13 mutant cells (GFP-negative), as indicated by lack of LysoTracker Red staining. (C) Atg13−/− cells (mCherry-negative) accumulate high levels of transgenic GFP-Ref(2)P. (D) Atg13 mutant cells (GFP-negative) fail to induce mCherry-Atg8a labeled vesicles in response to 24-h rapamycin treatment. (E) Loss of Atg13 does not disrupt induction of autophagy in response to activation of Jnk signaling. Expression of the Jun-kinase homolog Bsk (GFP-positive cells) results in high levels of punctate LysoTracker staining in both Atg13 mutant animals (shown) and wild-type control animals (unpublished data). Scale bar in A represents 10 μm in A, C, and D and 25 μm in B and E. Genotypes: (A and D) hsFLP; Cg-GAL4/+; UAS-mChAtg8a FRT82B UAS-GFPnls/FRT82B Atg13Δ74; (B) hsFLP; Cg-GAL4/+; FRT82B UAS-GFPnls/FRT82B Atg13Δ81; (C) hsFLP; Cg-GAL4/UAS-GFP-Ref(2)P; FRT82B UAS-mCherry/FRT82B Atg13Δ81; and (E) hsFLP; Act>y+>GAL4 UAS-GFPnls/+; UAS-bsk Atg13Δ81/Atg13Δ81.
Figure 3.
Figure 3.
Coexpression of Atg1 and Atg13 increases their nutrient-dependent phosphorylation. Shown are immunoblot analyses of fat body tissues dissected from Drosophila larvae expressing the indicated transgenes using the hs-GAL4 driver. (A) Expression of Atg13 increases the phosphorylation of Myc-Atg1, particularly under fed conditions. The slower form of Myc-Atg1 under either fed or starved conditions is eliminated by calf intestinal phosphatase (CIP) treatment. (B) Phosphorylation of kinase-defective Myc-Atg1 under fed conditions is less relative to wild-type Myc-Atg1. Coexpression of Tsc1 and Tsc2 further reduces Myc-Atg1KD phosphorylation. Samples expressing Myc-Atg1KD (lanes 5–8) were diluted fivefold to equalize levels of Myc-Atg1WT and Myc-Atg1KD expression. (C) Coexpression of Rheb increases the level of Myc-Atg1 phosphorylation under starvation conditions, and Tsc1/Tsc2 decreases the level of Myc-Atg1 phosphorylation under fed conditions. (D) Mobility of Atg13-Flag under starvation conditions is markedly decreased by coexpression of Myc-Atg1, because of increased phosphorylation as shown by CIP treatment. (E) Coxpression of kinase-defective Myc-Atg1 does not lead to increased Atg13-Flag phosphorylation. (F) Coexpression of Rheb increases Atg13-Flag phosphorylation under fed conditions. Overexpression of Tsc1/Tsc2 has little effect on Atg13-Flag phosphorylation. (G) Phosphorylation of Atg13-Flag is undetectable upon expression of kinase-defective Myc-Atg1 and disruption of TOR signaling by Tsc1/Tsc2 overexpression.
Figure 4.
Figure 4.
Biochemical and genetic interactions between Atg1 and Atg13. (A) Atg1 and Atg13 associate under both fed and starved conditions. Fat body extracts from larvae expressing Atg13-Flag ± Myc-Atg1 using the hs-GAL4 driver were immunoprecipitated with anti-Myc beads. Both hyper- and hypo-phosphorylated forms of Atg13 are coprecipitated with Myc-Atg1, and starvation increases the interaction. Atg13 is also coprecipitated with kinase defective Myc-Atg1, which expresses at a substantially higher level than wild-type Myc-Atg1. (B–D) Atg13 stimulates the autophagic activity of Myc-Atg1. Representative images of fat body tissues expressing mCherry-Atg8a and indicated transgenes in response to hs-GAL4, 24 h after 1-h heat shock. Under fed conditions, mCherry-Atg8a is diffuse in controls (B) and forms small, perinuclear autophagosomes in cells expressing Myc-Atg1 (C). Coexpression of Myc-Atg1 and Atg13 at low levels (D) leads to a strong induction of autophagosome formation. (E–G) Myc-Atg1 and Atg13 cooperate to suppress cell growth. Expression of either Myc-Atg1 (E) or Atg13 (F) in GFP-marked fat body cell clones does not have an appreciable effect on cell size. Cells coexpressing Myc-Atg1 and Atg13 are markedly reduced in size relative to neighboring control (GFP-negative) cells (G). Cell boundaries are highlighted by Alexa Fluor 555 phalloidin staining in red. (H–K) Expression of either Myc-Atg1 or Atg13 in the developing eye using the GMR-GAL4 driver has no discernable effect on eye development (I and J), whereas coexpression leads to a disruption of ommatidial patterning (K). (L) Constitutive expression of Myc-Atg1 or Atg13 throughout the larval fat body using the Cg-GAL4 driver does not affect larval growth or developmental timing. Coexpression of these transgenes leads to a growth and developmental arrest at the first instar stage of development. (M) Atg13 is required for induction of autophagy by Atg1 overexpression under fed conditions. Cg-GAL4-driven expression of Myc-Atg1 induces punctate localization of mCherry-Atg8a in GFP-positive control cells, but not in clones of cells mutant for Atg13, marked by lack of GFP. Scale bar in B represents 10 μm in B–G and M, 100 μm in H–K, and 700 μm in L. Genotypes: (B) hs-GAL4 UAS-mCherry-Atg8a/+; (C) hs-GAL4 UAS-mCherry-Atg8a/UAS-Myc-Atg1; (D) UAS-Atg13/+; hs-GAL4 UAS-mCherry-Atg8a/UAS-Myc-Atg1; (E) hsFLP; Act>CD2>GAL4 UAS-GFP/UAS-Myc-Atg1; (F) hsFLP; UAS-Atg13/+; Act>CD2>GAL4 UAS-GFP/+; (G) hsFLP; UAS-Atg13/+; Act>CD2>GAL4 UAS-GFP/UAS-Myc-Atg1; (H) GMR-GAL4/+; (I) GMR-GAL4/+; UAS-Myc-Atg1/+; (J) GMR-GAL4/UAS-Atg13; (K) GMR-GAL4/UAS-Atg13; UAS-Myc-Atg1/+; (L) left to right: Cg-GAL4/+, Cg-GAL4/+; UAS-Myc-Atg1/+, Cg-GAL4/UAS-Atg13, Cg-GAL4/UAS-Atg13; UAS-Myc-Atg1/+; and (M) hsFLP/UAS-Myc-Atg1; Cg-GAL4/+; UAS-mCherry-Atg8a FRT82B UAS-GFPnls/FRT82B Atg13Δ74.
Figure 5.
Figure 5.
Inhibition of autophagy by Atg13 overexpression. All panels depict fat body tissues from 4-h starved animals, unless otherwise indicated. (A and B) Starvation induces induction of mCherry-Atg8a–positive autophagosomes in controls (A) but not in animals overexpressing Atg13 (B). (C) Clonal expression of Atg13-GFP cell autonomously disrupts accumulation of LysoTracker Red—labeled autolysosomes. (D and E) Distribution of Atg13-GFP changes from a diffuse pattern under fed conditions (D) to small, uniform punctate structures after 4-h starvation (E). Atg13-GFP punctae (boxed area in E, enlarged in E′) are smaller than mCherry-Atg8a labeled autophagosomes and autolysosomes (boxed area in A, enlarged in A′). (F) In cells with high levels of Atg13-GFP expression, most Atg13-GFP–positive structures fail to label with mCherry-Atg8a. Yellow circles indicate examples of colocalization. (G) Atg13-GFP localizes to mCherry-Atg8a–labeled autophagosomes in cells with low levels of Myc-Atg1 and Atg13-GFP coexpression. Yellow circles indicate examples of colocalization. (H) Loss of Atg13 leads to increased levels of Myc-Atg1. A two-cell clone of Atg13 mutant cells (marked by lack of GFP) contains higher levels of Myc-Atg1 (red) than in neighboring control cells. (I and J) Starvation-induced Atg13-GFP redistribution is blocked by coexpression of Rheb (I) but is independent of Atg1 (J). Atg13-GFP is localized to punctate structures in both control cells and in cell clones homozygous mutant for Atg1 (central cell in J). Scalebar in A represents 10 μm in all panels, except A′ and E′ 5 μm, in C 38 μm, and in H 20 μm. Genotypes: (A) hsFLP/+; Act>CD2>GAL4 UAS-mCherry-Atg8a/+; (B–E) hsFLP/+; UAS-Atg13-GFP/+; Act>CD2>GAL4 UAS-mCherry-Atg8a/+; (F) UAS-Atg13-GFP/+; hsGAL4 UAS-mCherry-Atg8a/+; (G) UAS-Atg13-GFP/+; hsGAL4 UAS-mCherry-Atg8a/UAS-Myc-Atg1; (H) hsFLP/UAS-Myc-Atg1; Cg-GAL4/+; UAS-mCherry-Atg8a FRT82B UAS-GFPnls/FRT82B Atg13Δ74; (I) hsFLP/+; UAS-Atg13-GFP/+; Act>CD2>GAL4 UAS-GFPnls UAS-RhebAV4; and (J) hsFLP/+; UAS-Atg13-GFP/Cg-GAL4; FRT82B UAS-myrRFP/Atg1Δ3D FRT80B.
Figure 6.
Figure 6.
Reciprocal inhibitory interactions between Atg1/Atg13 and TOR. (A and B) Suppression of TOR activity by Myc-Atg1 and Atg13. Fat body extracts from late third instar animals expressing Myc-Atg1 and/or Atg13 with hs-GAL4 were assayed for phosphorylation of endogenous dS6K. (A) Phosphorylation of dS6K Thr398 is moderately inhibited by Myc-Atg1 expression, unaffected by Atg13 expression, and strongly reduced by coexpression of Myc-Atg1 and Atg13. Levels of endogenous d4EBP, which is transcriptionally inhibited by TOR signaling, rise to detectable levels in response to Myc-Atg1 and Atg13 expression (A). (B) Phosphorylation of Thr37/46 of overexpressed d4EBP is inhibited in response to Atg1 overexpression. (C–E) Disruption of TOR trafficking by Myc-Atg1 and Atg13. hs-GAL4-driven Flag-TOR is localized to a perinuclear compartment in control fat body cells 24 h after induction (C). Coexpression of low levels of Myc-Atg1 and Atg13 leads to accumulation of Flag-TOR in punctate/vesicular structures (D). Constitutively expressed Flag-TOR (E) localizes to the surface of vesicles and punctate structures in control cells (GFP-positive in E′). These structures and overall levels of Flag-TOR are reduced in clones of cells mutant for Atg13 (GFP-negative cells in E′). (F and G) TOR activity inhibits Myc-Atg1 accumulation. Myc-Atg1 was uniformly expressed in all fat body cells using Cg-GAL4, and its levels in clones of Tsc1 mutant cells (F) and Rheb mutant cells (G) were compared with that in neighboring control cells (GFP positive cells in F′ and G′). Loss of Tsc1 reduces and loss of Rheb increases Myc-Atg1 levels. Scale bars, (C–G) 10 μm. (H) Coimmunoprecipitation of Atg1 and TOR from fed and starved animals. Fat body extracts from larvae expressing hs-GAL4-driven Flag-TOR alone or Flag-TOR and Myc-Atg1 together were immunoprecipitated with Anti-Myc beads. (I) Hs-GAL4-driven coexpression of Flag-TOR stimulates phosphorylation of Myc-Atg1. Genotypes: (C) hsFLP/+; UAS-Flag-dTORF4A/+; Act>CD2>GAL4; (D) hsFLP/+; UAS-FlagTORF4A/UAS-Atg13; Act>CD2>GAL4/UAS-Myc-Atg1; (E) hsFLP/+; UAS-FlagTORF4A/+; r4-GAL4 FRT82B UAS-GFPnls/FRT82B Atg13Δ81; (F) hsFLP/UAS-MycAtg1; Cg-GAL4/+; FRT82B UAS-GFPnls/FRT82B Tsc129; (G) hsFLP/UAS-MycAtg1; Cg-GAL4/+; FRT82B UAS-GFPnls/FRT82B Rheb2D1.

References

    1. Chan E. Y., Kir S., Tooze S. A. siRNA screening of the kinome identifies ULK1 as a multidomain modulator of autophagy. J. Biol. Chem. 2007;282:25464–25474. - PubMed
    1. Chan E. Y., Longatti A., McKnight N. C., Tooze S. A. Kinase-inactivated ULK proteins inhibit autophagy via their conserved C-terminal domain using an Atg13-independent mechanism. Mol. Cell. Biol. 2008;29:157–171. - PMC - PubMed
    1. Cheong H., Nair U., Geng J., Klionsky D. J. The Atg1 kinase complex is involved in the regulation of protein recruitment to initiate sequestering vesicle formation for nonspecific autophagy in Saccharomyces cerevisiae. Mol. Biol. Cell. 2008;19:668–681. - PMC - PubMed
    1. Cheong H., Yorimitsu T., Reggiori F., Legakis J. E., Wang C. W., Klionsky D. J. Atg17 regulates the magnitude of the autophagic response. Mol. Biol. Cell. 2005;16:3438–3453. - PMC - PubMed
    1. Funakoshi T., Matsuura A., Noda T., Ohsumi Y. Analyses of APG13 gene involved in autophagy in yeast, Saccharomyces cerevisiae. Gene. 1997;192:207–213. - PubMed

Publication types

MeSH terms

Substances