. 2009 Apr;20(7):2083-95.
doi: 10.1091/mbc.e08-11-1126. Epub 2009 Feb 18.

Functional interactions between sphingolipids and sterols in biological membranes regulating cell physiology

Affiliations

Functional interactions between sphingolipids and sterols in biological membranes regulating cell physiology

Xue Li Guan et al. Mol Biol Cell. 2009 Apr.

Abstract

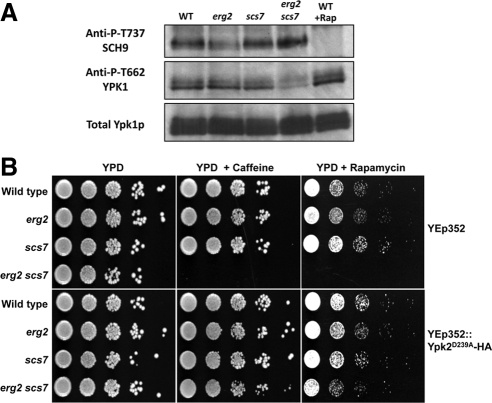
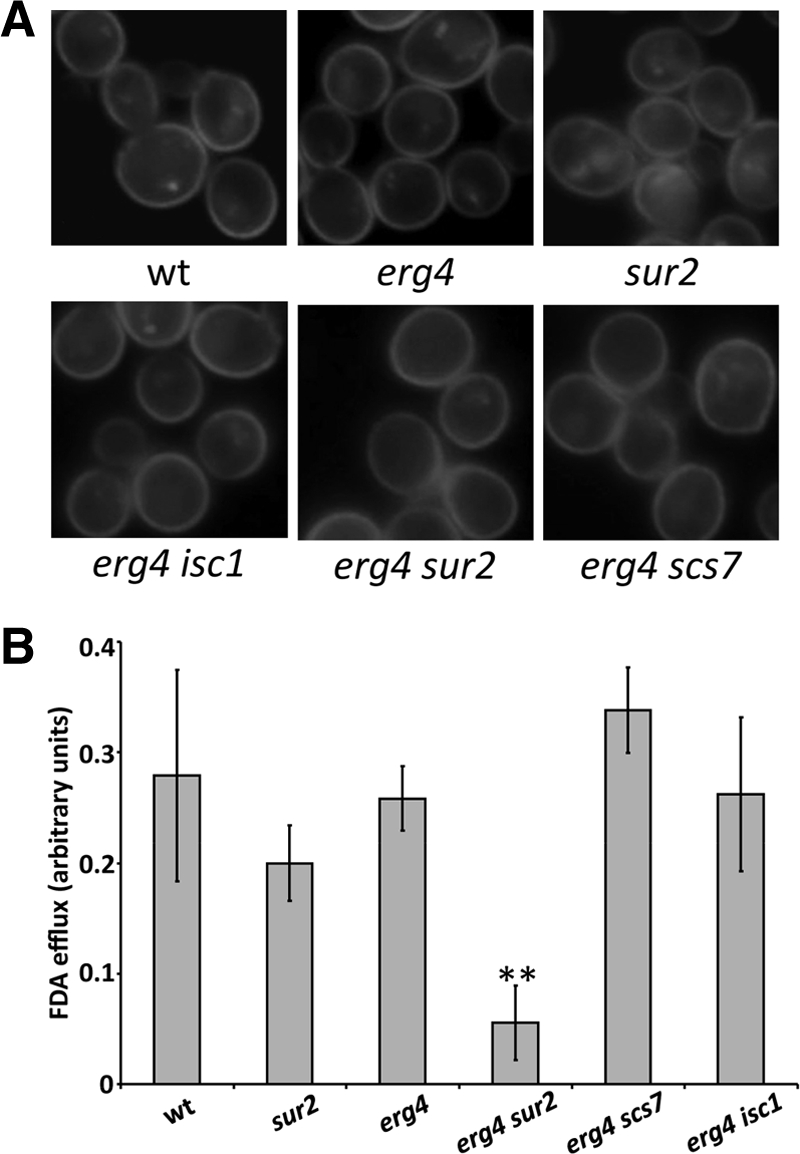
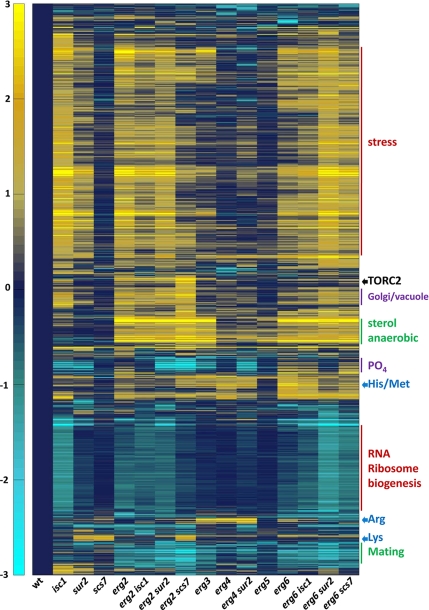
Sterols and sphingolipids are limited to eukaryotic cells, and their interaction has been proposed to favor formation of lipid microdomains. Although there is abundant biophysical evidence demonstrating their interaction in simple systems, convincing evidence is lacking to show that they function together in cells. Using lipid analysis by mass spectrometry and a genetic approach on mutants in sterol metabolism, we show that cells adjust their membrane composition in response to mutant sterol structures preferentially by changing their sphingolipid composition. Systematic combination of mutations in sterol biosynthesis with mutants in sphingolipid hydroxylation and head group turnover give a large number of synthetic and suppression phenotypes. Our unbiased approach provides compelling evidence that sterols and sphingolipids function together in cells. We were not able to correlate any cellular phenotype we measured with plasma membrane fluidity as measured using fluorescence anisotropy. This questions whether the increase in liquid order phases that can be induced by sterol-sphingolipid interactions plays an important role in cells. Our data revealing that cells have a mechanism to sense the quality of their membrane sterol composition has led us to suggest that proteins might recognize sterol-sphingolipid complexes and to hypothesize the coevolution of sterols and sphingolipids.


Figures

Figure 1.
Figure 1.
Structures of some abundant sphingolipid, sterol, and glycerophospholipid species in S. cerevisiae. ISC1 encodes an inositolphosphorylceramide (IPC) hydrolase that converts IPC to ceramide and inositol phosphate. SUR2 and SCS7 encode enzymes responsible for hydroxylation of the sphingoid base and fatty acid, respectively, of sphingolipids. The last five steps of ergosterol biosynthesis are shown. The order of events is not implied here. For comparison, we show one of the most abundant yeast glycerophospholipids, 34:1 phosphatidylinositol. For details see Supplementary Figure S1. Structures were drawn with ACD/ChemSketch freeware.
Figure 2.
Figure 2.
Lipidome of mutants in ergosterol biosynthesis. Isogenic wild-type and ergosterol mutant strains were grown as indicated. Lipid standards were added to 50 OD600-equivalents of cells, and lipids were extracted and measured using ESI-MS (Guan and Wenk, 2006). The quantities of lipids are expressed as ion intensities relative to wild-type levels, converted to a log10 scale. Glycerophospholipids: GPCho, glycerophosphocholine; GPEtn, glycerophosphoethanolamine; GPIns, glycerophosphoinositol; GPSer, glycerophosphoserine. Sphingolipids: IPC, inositol phosphorylceramide; MIPC, mannosyl inositol phosphorylceramide. The suffixes -B, -C, and -D on IPC and MIPC denote hydroxylation states, having two, three, or four hydroxyl groups, respectively. Data are presented as means of three independent biological samples. Statistical significance between wild-type and individual genotypes was determined using the Kruskal Wallis test. * p < 0.05.
Figure 3.
Figure 3.
Systematic phenotypic analysis. The indicated strains were grown and pinned onto YPD or YPEG (1% yeast extract, 2% peptone, 3% ethanol, 3% glycerol, and 40 mM MES, pH 5.5) plates and grown at 30°C except when indicated. Plates were photographed after 2 (30 and 37°C) or 4 d (YPEG). Arrows denote conditions where sterol–sphingolipid double mutants showed different growth than the single erg mutants under the conditions shown. Each asterisk represents where the double mutant shows a change in growth properties (synthetic growth defect or suppression) when compared with the single erg mutant (Supplementary Figure S3). Of the 15 double mutants constructed, 13 showed synthetic phenotypes.
Figure 4.
Figure 4.
Examples of suppression and synthetic phenotypes. Dilutions of indicated strains were spotted onto plates under the following conditions; 16°C (A), 2 mM caffeine (B), 1 μg/ml YW3548 (C, left), 0.01% SDS (C, right) or 1 mM sorbic acid at pH 4.5 (D).
Figure 5.
Figure 5.
Hypersensitivity to caffeine and rapamycin is due to decrease in TORC2 activity. (A) Protein extracts were prepared from log phase cultures of wild-type, erg2, scs7, and erg2 scs7 mutant strains. The extent of phosphorylation of the hydrophobic motifs in Ypk1 and Sch9 (indicative of TORC2 and TORC1 activity, respectively) were determined by SDS-PAGE and Western blotting. Rapamycin treatment was for 20 min with 200 ng/ml. B) The same yeast strains, transformed with empty vector (Yep352) or an activated allele of Ypk2p (Yep352::Ypk2D239A-HA were grown to stationary phase, diluted, and 10-fold serial dilutions were plated onto plates containing 2 mM caffeine or 20 ng/ml rapamycin.
Figure 6.
Figure 6.
Sorbic acid sensitivity in erg4 sur2 is due to defective export by Pdr12p. (A) Pdr12p-CFP was visualized in the indicated strains. (B) The same strains were loaded with fluorescein diacetate in the presence of 2-deoxygluose to deplete ATP. The cells were harvested and resuspended in glucose containing medium and extracellular fluorescein was quantified after 15 and 30 s. Relative rates of FDA export per minute are shown. * p < 0.05 by the t test for mean.
Figure 7.
Figure 7.
Cluster map of transcripts that change in the sterol and sphingolipid mutants. Transcript levels were determined in the indicated strains. Data for transcripts that changed at least twofold under one condition were clustered. Predominant characteristics of gene clusters are indicated on the right. An expandable version of the figure with gene names or identifiers is provided (Supplementary Figure S6). The scale is a log transformed base 2.

Comment in

References

    1. Ahmed S. N., Brown D. A., London E. On the origin of sphingolipid/cholesterol-rich detergent-insoluble cell membranes: physiological concentrations of cholesterol and sphingolipid induce formation of a detergent-insoluble, liquid-ordered lipid phase in model membranes. Biochemistry. 1997;36:10944–10953. - PubMed
    1. Aittoniemi J., Niemela P. S., Hyvonen M. T., Karttunen M., Vattulainen I. Insight into the putative specific interactions between cholesterol, sphingomyelin, and palmitoyl-oleoyl phosphatidylcholine. Biophys. J. 2007;92:1125–1137. - PMC - PubMed
    1. Aittoniemi J., Rog T., Niemela P., Pasenkiewicz-Gierula M., Karttunen M., Vattulainen I. Tilt: major factor in sterols' ordering capability in membranes. J. Phys. Chem. B Condens. Matter Mater. Surf. Interfaces Biophys. 2006;110:25562–25564. - PubMed
    1. Anderson R. G., Jacobson K. A role for lipid shells in targeting proteins to caveolae, rafts, and other lipid domains. Science. 2002;296:1821–1825. - PubMed
    1. Bagnat M., Keranen S., Shevchenko A., Shevchenko A., Simons K. Lipid rafts function in biosynthetic delivery of proteins to the cell surface in yeast. Proc. Natl. Acad. Sci. USA. 2000;97:3254–3259. - PMC - PubMed

Publication types

MeSH terms