. 2009 May;101(5):2581-600.
doi: 10.1152/jn.91198.2008. Epub 2009 Feb 18.

Neural representations of faces and body parts in macaque and human cortex: a comparative FMRI study

Affiliations

Neural representations of faces and body parts in macaque and human cortex: a comparative FMRI study

Mark A Pinsk et al. J Neurophysiol. 2009 May.

Abstract

Single-cell studies in the macaque have reported selective neural responses evoked by visual presentations of faces and bodies. Consistent with these findings, functional magnetic resonance imaging studies in humans and monkeys indicate that regions in temporal cortex respond preferentially to faces and bodies. However, it is not clear how these areas correspond across the two species. Here, we directly compared category-selective areas in macaques and humans using virtually identical techniques. In the macaque, several face- and body part-selective areas were found located along the superior temporal sulcus (STS) and middle temporal gyrus (MTG). In the human, similar to previous studies, face-selective areas were found in ventral occipital and temporal cortex and an additional face-selective area was found in the anterior temporal cortex. Face-selective areas were also found in lateral temporal cortex, including the previously reported posterior STS area. Body part-selective areas were identified in the human fusiform gyrus and lateral occipitotemporal cortex. In a first experiment, both monkey and human subjects were presented with pictures of faces, body parts, foods, scenes, and man-made objects, to examine the response profiles of each category-selective area to the five stimulus types. In a second experiment, face processing was examined by presenting upright and inverted faces. By comparing the responses and spatial relationships of the areas, we propose potential correspondences across species. Adjacent and overlapping areas in the macaque anterior STS/MTG responded strongly to both faces and body parts, similar to areas in the human fusiform gyrus and posterior STS. Furthermore, face-selective areas on the ventral bank of the STS/MTG discriminated both upright and inverted faces from objects, similar to areas in the human ventral temporal cortex. Overall, our findings demonstrate commonalities and differences in the wide-scale brain organization between the two species and provide an initial step toward establishing functionally homologous category-selective areas.


Figures

FIG. 1.
FIG. 1.
Sample visual stimuli for faces, monkey body parts, foods, man-made objects, and indoor laboratory scenes. All stimuli were colored, 12 × 12°, and presented foveally while subjects maintained fixation. A: sample stimuli used in experiment 1 with the macaque subjects. B: additional sample stimuli used in experiment 1 for the human subjects. C: sample stimuli used in experiment 2 with the macaque subjects. D: additional sample stimuli used in experiment 2 for the human subjects.
FIG. 2.
FIG. 2.
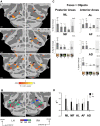
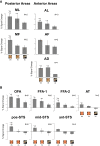
Face-selective representations in monkey temporal cortex. A: activation maps in monkeys M1 through M3 depicting areas activated significantly more by faces compared with objects (P < 0.01, uncorrected for multiple comparisons) projected onto flattened cortical surfaces. Color scale bar indicates F-score values of functional activity in colored areas. Areas in temporal cortex found in at least 2 of the 3 monkeys are labeled as regions of interest (ROIs; i.e., ML, MF, AL, AF, AD). B: ROIs of monkeys M1 through M3 (M1 = red, M2 = blue, M3 = green) projected onto the standardized surface of a single monkey (M3). Dotted ovals encircle each ROI. C: mean signal changes from 5 ROIs averaged across the 3 monkeys. Vertical error bars denote the SE. Abbreviations above each bar denote significant differences (P < 0.05) between faces, body parts, foods, and scenes with matched paired t-test. Mean signal change for the objects condition is shown within gray bar as a reference (see methods). D: selectivity indices from each area. Selectivity of each area to faces (black) and body parts (white) relative to the foods, objects, and scenes, computed with an index (see methods). LH, left hemisphere; RH, right hemisphere; ML, middle lateral; MF, middle fundus; AL, anterior lateral; AF, anterior fundus; AD, anterior dorsal; sf, sylvian fissure; sts, superior temporal sulcus; ios, inferior occipital sulcus; ots, occipital temporal sulcus; amts, anterior middle temporal sulcus; fa, face condition; bp, body part condition; fd, food condition; ob, object condition; sc, scene condition.
FIG. 3.
FIG. 3.
Face-selective representations in human temporal cortex. A: activation maps in the right hemispheres of 3 representative subjects (S1–S3) depicting areas activated significantly more by faces than by objects (P < 0.0001, uncorrected for multiple comparisons) projected onto flattened cortical surfaces. Areas in temporal cortex found in at least half of the subjects are labeled as ROIs (i.e., OFA, FFA-1/2, AT, pos-STS, mid-STS, ant-STS). B: mean signal changes from 4 ventral and 3 lateral ROIs averaged across 6 subjects. Mean signal change for the objects condition is shown within gray bar as a reference (see methods). C: selectivity indices from each area to faces (black) and body parts (white) relative to the foods, objects, and scenes. D: ROIs of subjects S1–S3 (S1 = red, S2 = blue, S3 = green) projected onto the standardized surface of a single subject (S1). OFA, occipital face area; FFA-1/2, fusiform face areas 1 and 2; AT, anterior temporal area; pos-STS, posterior superior temporal sulcus; mid-STS, middle STS; ant-STS, anterior STS; ots, occipitotemporal sulcus; sts, superior temporal sulcus; cos, collateral sulcus. See Fig. 2 for further details.
FIG. 4.
FIG. 4.
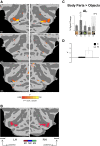
Body part–selective representations in monkey temporal cortex. A: activation maps in monkeys M1 through M3 depicting areas activated significantly more by body parts than by objects (P < 0.01, uncorrected for multiple comparisons) projected onto flattened cortical surfaces. Only areas found in at least 2 of the 3 monkeys are labeled as ROIs (i.e., AL). B: ROIs of monkeys M1 through M3 (M1 = red, M2 = blue, M3 = green) projected onto the standardized surface of a single monkey (M3). C: mean signal changes from ROI AL averaged across the 3 monkeys. D: selectivity index of ROI AL to faces (black) and body parts (white) relative to the foods, objects, and scenes. See Fig. 2 for further details.
FIG. 5.
FIG. 5.
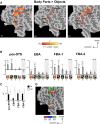
Body part–selective representations in human temporal cortex. A: activation maps in the right hemispheres of 3 representative subjects (S1–S3) depicting areas activated significantly more by body parts than by objects (P < 0.0001, uncorrected for multiple comparisons) projected onto flattened cortical surfaces. Areas in temporal cortex found in at least half of the subjects are labeled as ROIs (i.e., FBA-1/2, EBA, pos-STS). B: mean signal changes from ROIs averaged across 6 subjects. C: selectivity indices from each ROI. D: ROIs of subjects S1–S3 (S1 = red, S2 = blue, S3 = green) projected onto the standardized surface of a single subject (S1). EBA, extrastriate body area; FBA-1/2, fusiform body areas 1 and 2. See Fig. 3 for further details.
FIG. 6.
FIG. 6.
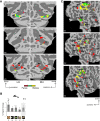
Topographic relationship of face- and body part–selective areas. A: flattened cortical surfaces of monkeys M1 through M3 depicting the relative spatial locations of face and body part ROIs. ROIs are color-coded according to their preferred category. Faces > objects = red, body parts > objects = yellow, overlapping areas = green. B: mean signal changes from face ROI AL, which has been redefined to exclude any overlapping regions. C: flattened cortical surfaces of the right hemispheres of 3 representative human subjects (S1–S3) also depicting the relative spatial locations of face and body part ROIs. See Figs. 2 through 5 for further details.
FIG. 7.
FIG. 7.
Mean signal change of face-selective areas during the presentation of upright and inverted faces. A: comparison for monkey face ROIs to upright monkey faces, inverted monkey faces, and objects. B: similar comparison for human face ROIs, using human face stimuli. Vertical error bars denote SE. Abbreviations above each bar denote significant differences (P < 0.05) between conditions with matched paired t-test. See Figs. 2 and 3 for further details.

References

    1. Afraz SR, Kiani R, Esteky H. Microstimulation of inferotemporal cortex influences face categorization. Nature 442: 692–695, 2006. - PubMed
    1. Aguirre GK, Singh R, D'Esposito M. Stimulus inversion and the responses of face and object-sensitive cortical areas. Neuroreport 10: 189–194, 1999. - PubMed
    1. Aguirre GK, Zarahn E, D'Esposito M. Neural components of topographical representation. Proc Natl Acad Sci USA 95: 839–846, 1998. - PMC - PubMed
    1. Allison T, Ginter H, McCarthy G, Nobre AC, Puce A, Luby M, Spencer DD. Face recognition in human extrastriate cortex. J Neurophysiol 71: 821–825, 1994. - PubMed
    1. Allison T, Puce A, McCarthy G. Social perception from visual cues: role of the STS region. Trends Cogn Sci 4: 267–278, 2000. - PubMed

Publication types