. 2009:5:245.
doi: 10.1038/msb.2009.2. Epub 2009 Feb 17.

Glucose regulates transcription in yeast through a network of signaling pathways

Affiliations

Glucose regulates transcription in yeast through a network of signaling pathways

Shadia Zaman et al. Mol Syst Biol. 2009.

Erratum in

  • Mol Syst Biol. 2009;5:257

Abstract

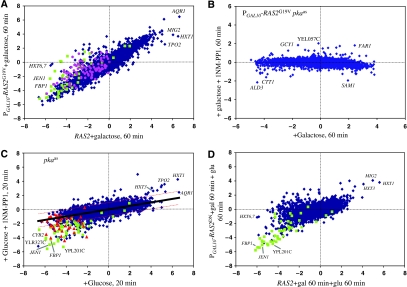
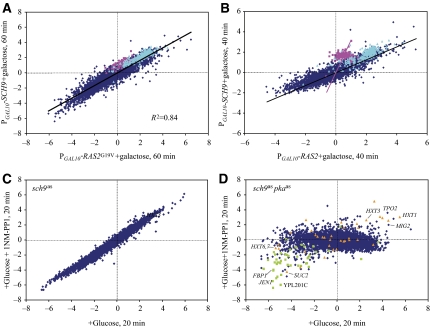
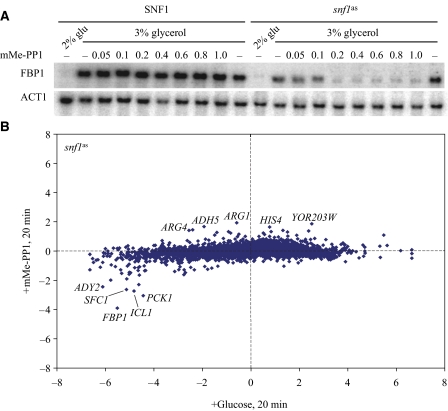
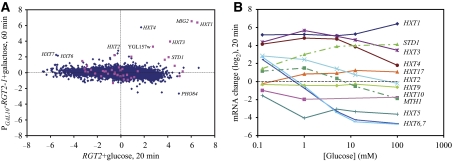
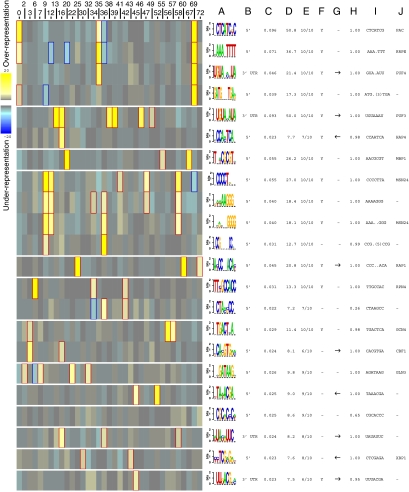
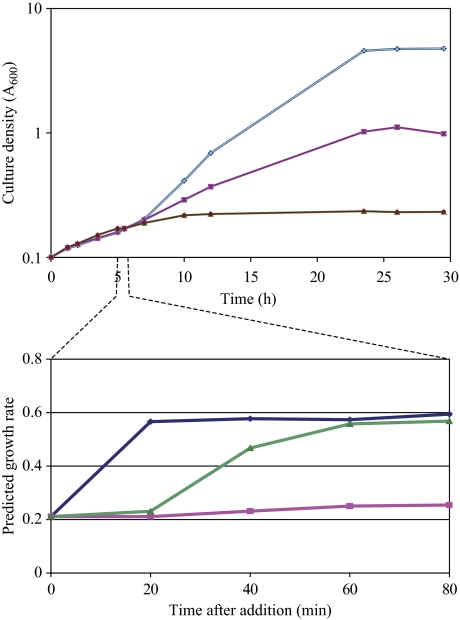
Addition of glucose to yeast cells increases their growth rate and results in a massive restructuring of their transcriptional output. We have used microarray analysis in conjunction with conditional mutations to obtain a systems view of the signaling network responsible for glucose-induced transcriptional changes. We found that several well-studied signaling pathways-such as Snf1 and Rgt-are responsible for specialized but limited responses to glucose. However, 90% of the glucose-induced changes can be recapitulated by the activation of protein kinase A (PKA) or by the induction of PKB (Sch9). Blocking signaling through Sch9 does not interfere with the glucose response, whereas blocking signaling through PKA does. We conclude that both Sch9 and PKA regulate a massive, nutrient-responsive transcriptional program promoting growth, but that they do so in response to different nutritional inputs. Moreover, activating PKA completely recapitulates the transcriptional growth program in the absence of any increase in growth or metabolism, demonstrating that activation of the growth program results solely from the cell's perception of its nutritional status.


Conflict of interest statement

The authors declare that they have no conflict of interest.

Figures

Figure 1
Figure 1
PKA mediates the primary transcriptional response of cells to glucose. Scatter plots of microarray data for ca. 5600 yeast genes, obtained from two different strains or conditions. Each point represents the log(2) change in levels of the mRNA for a single gene for one strain under one condition in the horizontal dimension and the log(2) change in mRNA levels for that gene in a different strain or condition in the vertical dimension. (A) Expression changes of all genes in a PGAL10-RAS2G19V strain (Y2866) pregrown on SC+3% glycerol, 60 min after the addition of 2% galactose relative to that at 0 min (vertical axis), versus a RAS2 strain (Y2864) pregrown on SC+3% glycerol, 20 min after glucose addition relative to 0 min (horizontal axis). (B) Both x- and y-axes show expression changes in PGAL10-RAS2G19V tpk1astpk2astpk3as (strain Y3621) pregrown on SC+3% glycerol, 60 min following the addition of galactose relative to 0 min. For the experiment in the vertical axis, 100 nM 1NM-PP1 was added concurrently with galactose. (C) Both x- and y-axes show expression changes in tpk1astpk2astpk3as (strain Y3561) grown on SC+3% glycerol 20 min following the addition of 2% glucose relative to 0 min. For the experiment in the vertical axis, 100 nM 1NM-PP1 was added concurrently with glucose. Solid black line shows the linear regression (y=0.26x), with the dotted red lines the two-fold limits from the regression line. (D) PGAL10-RAS2S24N (strain Y3168), pregrown on SC-glycerol and then preinduced with 2% galactose, 60 min after glucose addition relative to 0 min (vertical axis), versus RAS2 (strain Y2864) under the same conditions (horizontal axis). In all plots, genes whose expression is repressed more than two-fold by inactivation of Snf1 (see Figure 4) are shown in green, genes reported to be regulated by the Hap2/3/4/5 complex are shown in pink and those repressed more than two-fold by 125 μM glucose are shown in red.
Figure 2
Figure 2
Sch9 plays a minor role in glucose signaling. Microarray expression data presented as in Figure 1. (A) Expression changes of all genes in a PGAL1-SCH9 strain (Y3506) pregrown on SC+3% glycerol, 40 min after the addition of 2% galactose relative to that at 0 min (y-axis), versus a PGAL10-RAS2G19V strain (Y2866) pregrown on SC+3% glycerol, 40 min after galactose addition relative to 0 min (x-axis). Pink dots: cytoplasmic ribosomal protein genes; cyan dots: ribosomal biogenesis genes. Black line is the linear regression for the entire set of genes (slope=0.57) and the pink line passes through the origin and the centroid of ribosomal protein genes (slope=3.14). (B) Same as in (A) except at 60 min post-induction for both strains. (C) Both x- and y-axes show expression changes in sch9as (strain Y3561) grown on SC+3% glycerol 20 min following the addition of 2% glucose relative to 0 min. For the experiment in the y-axis, 100 nM 1NM-PP1 was added concurrently with glucose. Linear regression line (not shown) has a slope of 1.03 with an R2 value of 0.97. (D) Both x- and y-axes show expression changes in tpk1astpk2astpk3as sch9as (strain Y3508) grown on SC+3% glycerol 20 min following the addition of 2% glucose relative to 0 min. For the experiment in the vertical axis, 100 nM 1NM-PP1 was added concurrently with glucose. Green dots: genes whose expression is repressed more than 2 × by inactivation of Snf1; orange dots: genes induced more than 2 × by activation of Rgt2 (Figure 5).
Figure 3
Figure 3
Interaction of Gpr1/Gpa2 and Sch9. Microarray expression data presented as in Figure 1. (A) Both x- and y-axes show expression changes in a PGAL10-GPA2Q300L tpk1astpk2astpk3as strain (Y3581) pregrown on SC+3% glycerol, 60 min following the addition of galactose relative to 0 min. For the experiment in the y-axis, 100 nM 1NM-PP1 was added concurrently with galactose. (B) Expression changes in a gpr1Δ strain (Y3573) pregrown on SC+3% glycerol, 20 min after the addition of 2% glucose relative to that at 0 min (y-axis), versus a GPR1 strain (Y2864) pregrown on SC+3% glycerol, 20 min after glucose addition relative to 0 min (x-axis). (C) Expression changes of all genes in a PGAL10-GPA2Q300L tpk1astpk2astpk3as strain (Y3581) pregrown on SC+3% glycerol, 60 min after the addition of 2% galactose relative to that at 0 min (y-axis), versus a PGAL10-GPA2Q300L tpk1astpk2astpk3as sch9as strain (Y3578) pregrown on SC+3% glycerol, 60 min after galactose addition relative to 0 min (x-axis). (D) Expression of genes in a gpr1Δ strain (Y3573) relative to wild type (Y2864) during exponential growth in SC+3% glycerol (y-axis) versus that in a sch9as strain (Y3507) relative to wild type (Y2864) under the same conditions. Genes previously determined to be induced by treatment with ketoconazole (Agarwal et al, 2003) are shown in pink and those encoding the pauperin family of cell wall proteins are shown in cyan.
Figure 4
Figure 4
Snf1 controls a small set of glucose-regulated genes. (A) Strains Y2864 (SNF1) and Y3504 (snf1as) were grown to a density of A600=0.25 in SC+3% glycerol, at which point glucose was added to 2% or mMe-PP1 was added to the indicated concentration (μM). The northern blot of RNA samples from cells harvested 1 h after drug treatment, probed for FBP1 and ACT1 is shown. (B) Microarray data presented as in Figure 1 for strain Y3504 (snf1as) pregrown in SC+3% glycerol 20 min after the addition of 0.4 μM mMe-PP1 relative to 0 min (y-axis) or 20 min after the addition of glucose to 2% relative to 0 min (x-axis).
Figure 5
Figure 5
The Rgt network regulates a small number of glucose-induced genes. (A) Microarray data presented as in Figure 1 for a PGAL10-RGT2-1 strain pregrown in SC+3% glycerol 60 min after galactose addition relative to 0 min (y-axis) versus a RGT2 strain 20 min after glucose addition relative to 0 min. Genes that showed essentially normal induction by glucose in a tpk1astpk2astpk3as sch9as strain in the presence of 1NM-PP1 (Figure 2) are shown in pink. (B) Expression changes (log(2)) obtained from microarray experiments of the indicated HXT genes as well as STD1 and MTH1 as a function of concentration of glucose 20 min after its addition to wild-type strain Y2864 grown to mid log in SC+3% glycerol.
Figure 6
Figure 6
Identification of motifs associated with glucose-regulated genes. FIRE (finding informative regulatory elements) (Elemento et al, 2007) analysis of clustered data from Supplementary Figure S2 provided a heat map of the motifs (in rows) and the clusters in which they occur (in columns, numbers defined in Supplementary Tables S4 and S5). Only those clusters from which motifs were extracted are shown. Each identified motif is associated with (A) a predicted motif, (B) location of motif, either 5′ promoter region or 3′UTR, (C) mutual information (MI) score of the motif over the cluster indices (in bits), (D) z-score that measures the significance of the MI value as calculated using randomization tests, (E) robustness value calculated by doing 10 jack-knife trials after removing 1/3 of the data to test whether the motif repeatedly comes up as statistically significant, (F) position bias indicating whether the motif is concentrated at a specific location with respect to the translation start or stop site, (G) orientation bias, (H) conservation index as determined by comparison to Saccharomyces bayanus, (I) seed sequence and (J) motif name. The intensity of the yellow color in the heat map represents the degree to which the motif is over-represented in the specified cluster, whereas the intensity of the blue color represents the degree to which the motif is under-represented in the specified cluster. The genes in each cluster are listed in Supplementary Table S4 and statistically significant enrichments of functional categories in the different clusters are listed in Supplementary Table S5.
Figure 7
Figure 7
Growth versus growth rate prediction. Upper panel: growth of strain Y2866 (gal1 PGAL10-RAS2G19V) at 30°C on SC+3% glycerol with no additions (pink squares), addition of glucose to 2% at 5 h (blue diamonds) or addition of galactose to 2% at 5 h (green triangles). Lower panels: samples were taken at 20-min intervals from the time of additions from the cultures depicted in the upper panel, RNA was extracted and analyzed by microarray hybridization. The predicted growth rate based on the gene expression pattern in each culture using the algorithm described in Brauer et al (2008) is plotted as a function of time post-addition.
Figure 8
Figure 8
The glucose signaling network. Diagram of the regulatory wiring connecting the addition of glucose to the transcriptional responses of the cell. Dotted line indicates a limited or indirect connection. See text for details.

References

    1. Agarwal AK, Rogers PD, Baerson SR, Jacob MR, Barker KS, Cleary JD, Walker LA, Nagle DG, Clark AM (2003) Genome-wide expression profiling of the response to polyene, pyrimidine, azole, and echinocandin antifungal agents in Saccharomyces cerevisiae. J Biol Chem 278: 34998–35015 - PubMed
    1. Bishop AC, Buzko O, Shokat KM (2001) Magic bullets for protein kinases. Trends Cell Biol 11: 167–172 - PubMed
    1. Boles E, Hollenberg CP (1997) The molecular genetics of hexose transport in yeasts. FEMS Microbiol Rev 21: 85–111 - PubMed
    1. Brauer MJ, Huttenhower C, Airoldi EM, Rosenstein R, Matese JC, Gresham D, Boer VM, Troyanskaya OG, Botstein D (2008) Coordination of growth rate, cell cycle, stress response, and metabolic activity in yeast. Mol Biol Cell 19: 352–367 - PMC - PubMed
    1. Broach JR, Deschenes RJ (1990) The function of ras genes in Saccharomyces cerevisiae. Adv Cancer Res 54: 79–139 - PubMed

Publication types

MeSH terms