. 2008 Dec 15;2(2):199-207.
doi: 10.3389/neuro.01.037.2008. eCollection 2008 Dec.

Feature selectivity of the gamma-band of the local field potential in primate primary visual cortex

Affiliations

Feature selectivity of the gamma-band of the local field potential in primate primary visual cortex

Philipp Berens et al. Front Neurosci. .

Abstract

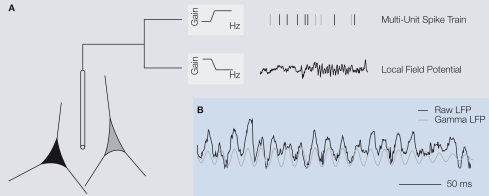
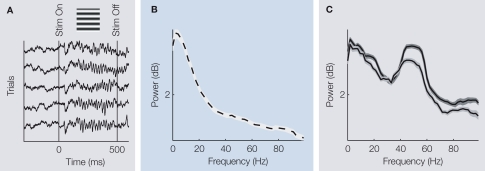
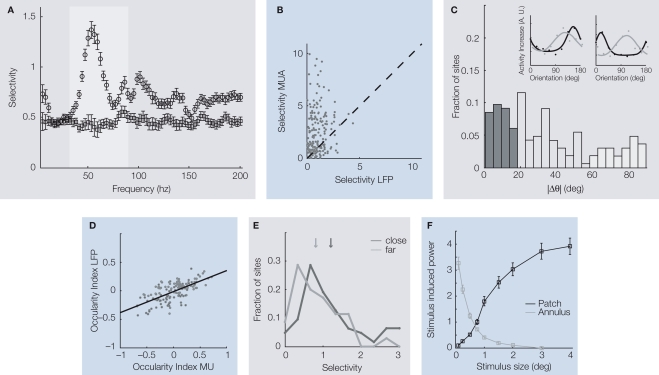
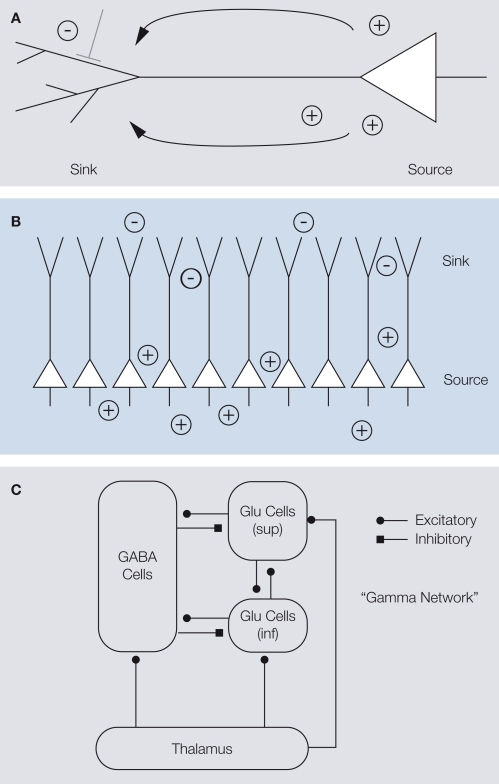
Extracellular voltage fluctuations (local field potentials, LFPs) reflecting neural mass action are ubiquitous across species and brain regions. Numerous studies have characterized the properties of LFP signals in the cortex to study sensory and motor computations as well as cognitive processes like attention, perception and memory. In addition, its extracranial counterpart - the electroencephalogram - is widely used in clinical applications. However, the link between LFP signals and the underlying activity of local populations of neurons remains largely elusive. Here, we review recent work elucidating the relationship between spiking activity of local neural populations and LFP signals. We focus on oscillations in the gamma-band (30-90 Hz) of the LFP in the primary visual cortex (V1) of the macaque that dominate during visual stimulation. Given that in area V1 much is known about the properties of single neurons and the cortical architecture, it provides an excellent opportunity to study the mechanisms underlying the generation of the LFP.

Keywords: feature selectivity; gamma-band; local field potential; primary visual cortex; spatial resolution.


Figures

Figure 1
Figure 1
(A) An extracellular electrode placed in the brain measures the mean extracellular field potential, an aggregate signal originating from the population of neurons in the vicinity of the electrode tip. To obtain multi-unit spiking activity, the recorded voltage trace is high-pass filtered and individual action potentials are detected (top). The local field potential (LFP) is comprised of the low frequency components of the extracellular field potential up to 200 Hz (bottom). Its frequency composition varies over time. In the example shown here, prominent oscillations in the frequency band between 30 and 90 Hz – called the gamma-band – are visible during the later part of the trace. (B) In primary visual cortex of awake primates, oscillations in the gamma-band of the local field potential are dominant during visual stimulation, as illustrated in the example. The raw signal (black) has been filtered in the gamma frequency range to obtain the gamma LFP (grey).
Figure 2
Figure 2
(A) Exemplar raw traces showing the LFP during a typical trial. Before the onset of stimulation, low frequency fluctuations dominate the LFP. During stimulation with an oriented grating, however, strong gamma-oscillations are visible. (B) Typical power spectrum of the LFP during the resting state. Low frequency fluctuations dominate the spectrum, which follows roughly a 1/f decay. (C) Typical power spectra of the LFP during visual stimulation with two gratings of different orientation (differing colours). A pronounced power increase in the gamma-band is observed. In particular, this increase depends in strength on the orientation of the visual stimulus. All displays in this figure were adapted from (Berens et al., 2008).
Figure 3
Figure 3
(A) Mean orientation selectivity of the power in a frequency band of the local field potential of a population of recording sites (open circles) and a trial shuffled version for comparison (open squares). The most prominent orientation selectivity is found in the gamma-band (grey shading) around 55 Hz. (B) Comparison of the mean orientation selectivity of the gamma-band of the LFP and MU activity recorded simultaneously from the same electrode. Although the most selective LFP band was chosen, MU selectivity is on average still significantly higher, as indicated by the dark cross. (C). Distribution of differences in preferred orientation for simultaneously recorded LFP gamma-band and MU activity. While a large fraction of sites shows good agreement between the two, in a considerable amount of sites the preferred orientations of the two signals differ by more than 60°. Dark grey (<20° difference) and light grey (>60° difference) indicate sites used for Figure 3E. The inset shows the orientation tuning functions of two exemplar sites, with LFP (light grey) and MU (dark grey) tuning functions overlaid. In the site shown on the left, both preferred orientations are close to each other while in the site shown on the right they are nearly 90° apart. (D) Ocularity index of MU activity and LFP gamma-band power. The ocularity index measures how strongly the activity at a site is modulated by the eye of stimulation. Its sign indicates which eye is preferred. Ocularity indices of the MU activity are significantly stronger than those of the LFP gamma-band, but they are correlated well. (E) Histogram of orientation selectivity index computed separately for sites with close (dark grey) and far away (light grey) preferred orientations [sites as in (C)]. Arrows indicate the respective medians. On average, sites where the preferred orientation of the LFP gamma-band agrees well with that of the MU have higher orientation selectivity than the others. (F) Average difference in gamma-power (25–100 Hz) between the spectrum during stimulus presentation and baseline (mean ± SEM) as a function of the diameter of the grating (black line) or the grating annulus (grey line) that was used for stimulation. For gratings, the gamma-power increases as a function of stimulus diameter. In the case of annuli, large values on the x-axis indicate that only the surround was stimulated. This alone was not sufficient to elicit pronounced gamma-oscillations. For experimental details regarding this panel, see Gieselmann and Thiele (2008). Panels (A–E) in this figure were adapted from Berens et al. (2008) and data for panel (F) was provided by Gieselmann and Thiele (2008).
Figure 4
Figure 4
(A) Illustration of a pyramidal cell, where the dendritic tree is shown schematically on the left, the cell body and axon on the right. A synaptic potential creates a current sink on the dendritic tree and a current-source at the soma. Adapted from Johnston and Wu (1995). (B) Pyramidal cells are aligned in a very stereotype fashion, with large dendritic arbours facing one direction and somata facing to the other. In this so-called open field arrangement, synchronized synaptic input creates strong dipoles, since currents flow from individual cells do not cancel each other. (C) Illustration of the excitatory-inhibitory cortical network involved in the generation of gamma-oscillations. Thalamic inputs activate populations of infragranular (inf) and supragranular and granular (sup) glutamergic cells, as well as GABAergic cells. These three groups interact with each other. Inhibitory synapses are indicated by a square (symbol), excitatory synapses by a circle (symbol). Adapted from Logothetis (2008).

References

    1. Andersen R. A., Musallam S., Pesaran B. (2004). Selecting the signals for a brain-machine interface. Curr. Opin. Neurobiol. 14 720–726 10.1016/j.conb.2004.10.005 - DOI - PubMed
    1. Angelucci A., Levitt J. B., Walton E. J., Hupe J. M., Bullier J., Lund J. S. (2002). Circuits for local and global signal integration in primary visual cortex. J. Neurosci. 22, 8633–8646 - PMC - PubMed
    1. Aronoff R., Petersen C. (2008). Layer, column and cell-type specific genetic manipulation in mouse barrel cortex. Front. Neurosci. 2, 64–71 10.3389/neuro.01.001.2008 - DOI - PMC - PubMed
    1. Bartfeld E., Grinvald A. (1992). Relationships between orientation-preference pinwheels, cytochrome oxidase blobs, and ocular-dominance columns in primate striate cortex. Proc. Natl. Acad. Sci. USA 89, 11905–11909 10.1073/pnas.89.24.11905 - DOI - PMC - PubMed
    1. Bartos M., Vida I., Jonas P. (2007). Synaptic mechanisms of synchronized gamma oscillations in inhibitory interneuron networks. Nat. Rev. Neurosci. 8, 45–56 10.1038/nrn2044 - DOI - PubMed

LinkOut - more resources