. 2009 Apr;72(1):124-38.
doi: 10.1111/j.1365-2958.2009.06629.x. Epub 2009 Feb 17.

Glycogen contributes to the environmental persistence and transmission of Vibrio cholerae

Affiliations

Glycogen contributes to the environmental persistence and transmission of Vibrio cholerae

Lori Bourassa et al. Mol Microbiol. 2009 Apr.

Abstract

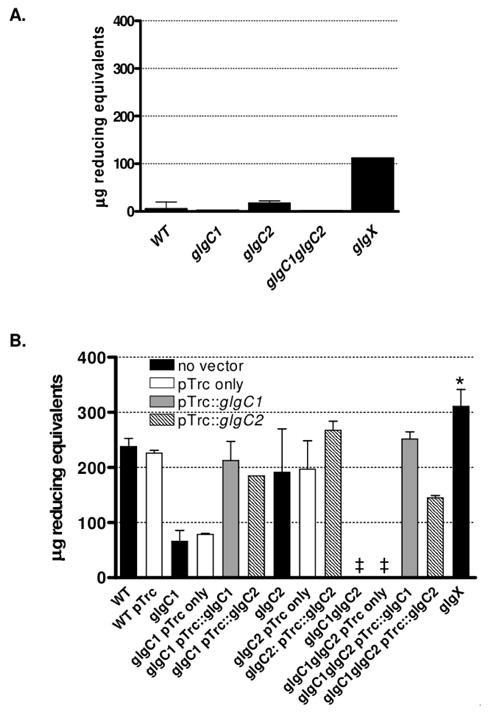
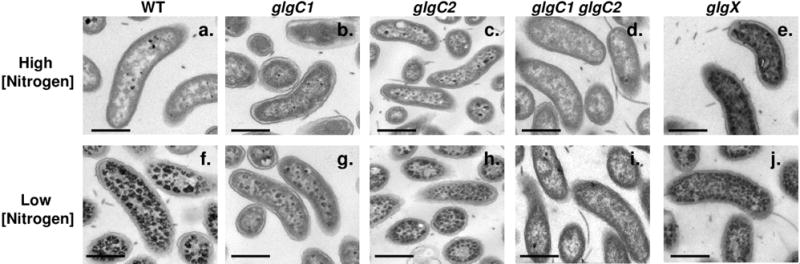
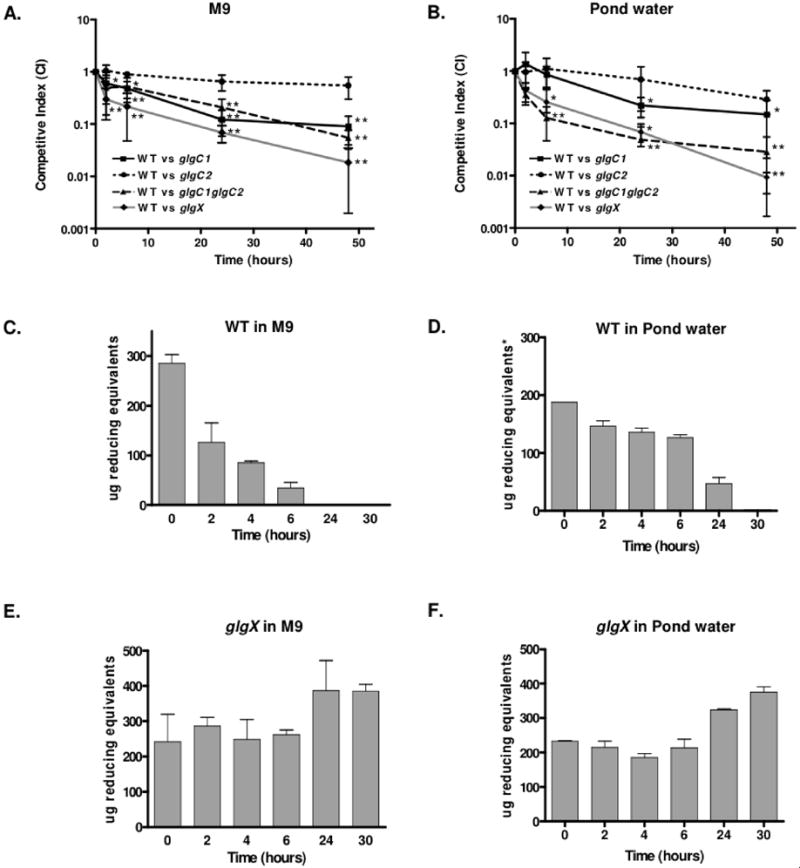
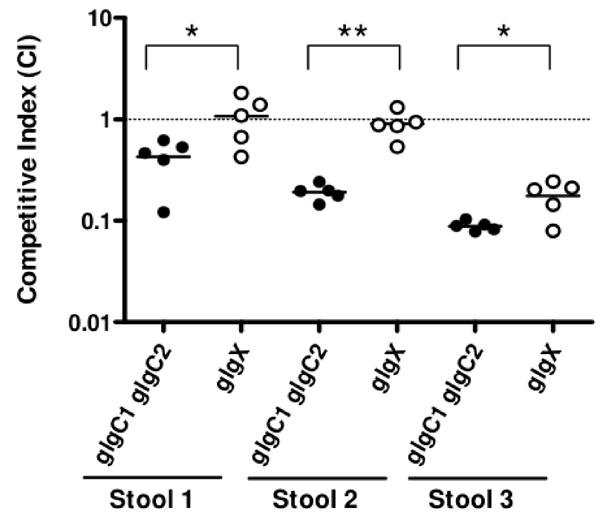
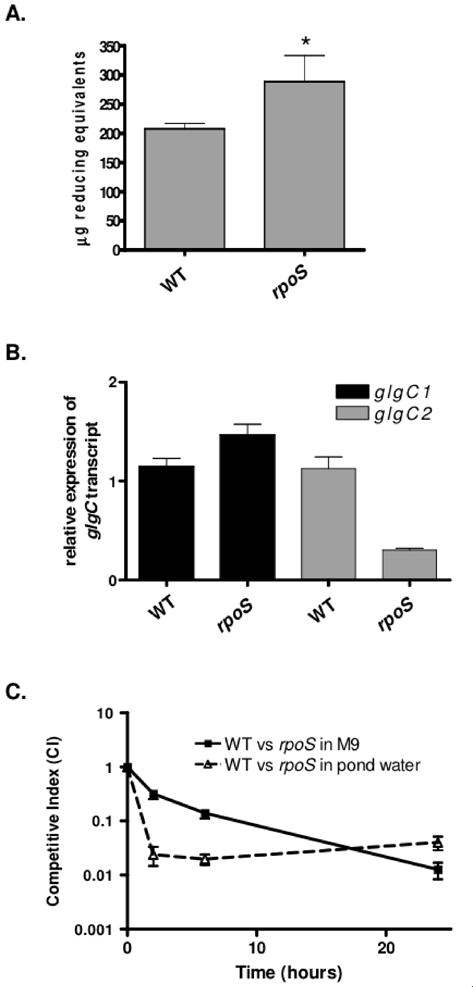
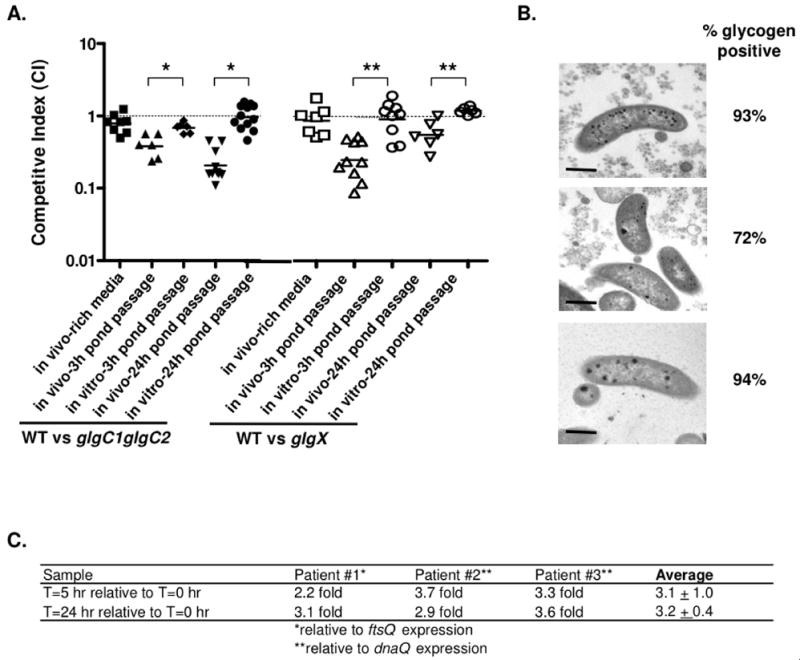
Pathogenic Vibrio cholerae cycle between the nutrient-rich human intestinal tract and nutrient-poor aquatic environments and currently few bacterial factors are known that aid in the transition between these disparate environments. We hypothesized that the ability to store carbon as glycogen would facilitate both bacterial fitness in the aquatic environment and transmission of V. cholerae to new hosts. To investigate the role of glycogen in V. cholerae transmission, we constructed mutants that cannot store or degrade glycogen. Here, we provide the first report of glycogen metabolism in V. cholerae and demonstrate that glycogen prolongs survival in nutrient-poor environments that are known ecological niches of V. cholerae, including pond water and rice-water stool. Additionally, glycogen contributes to the pathogenesis of V. cholerae in a transmission model of cholera. A role for glycogen in the transmission of V. cholerae is further supported by the presence of glycogen granules in rice-water stool vibrios from cholera patients, indicating that glycogen is stored during human infection. Collectively, our findings indicate that glycogen metabolism is critical for V. cholerae to transition between host and aquatic environments.


Figures

Figure 1
Figure 1. Nitrogen limitation induces glycogen storage in WT and glgC2
(A–B) Glycogen in WT, mutant and complemented strains was quantified after growth on high (A) or low (B) nitrogen M9-glucose agar by enzymatic hydrolysis of glycogen into glucose monomers. Liberated glucose was subsequently measured using the tetrazolium blue reducing sugar assay and expressed as μg reducing equivalents in 109 V. cholerae/mL. The median and interquartile range of two independent experiments each performed in triplicate are shown. The glgX strain accumulated significantly more glycogen than WT by a two-tailed student’s t-test (*p<0.005). The cross symbol indicates the amount of glycogen was below the limit of detection.
Figure 2
Figure 2. Visualization of glycogen granules by transmission electron microscopy
WT, glgC1, glgC2, glgC1 glgC2 and glgX were grown on M9-glucose agar with high or low nitrogen and grown at 37°C. Fixed, embedded sections of cells were stained with lead citrate. Glycogen appears as electron dense granules. Scale bar = 0.5 μm.
Figure 3
Figure 3. The glgC1 transcript is expressed to higher levels than glgC2 in low nitrogen conditions
Quantitative RT-PCR (qRT-PCR) analysis of glgC1 and glgC2 expression during growth on M9-glucose under nitrogen limitation at 37°C. Samples were collected during mid- and late-exponential growth (OD600 = 0.4 and OD600 = 0.8). All samples were prepared in triplicate and expression levels were normalized to rpoB expression in each sample and expressed relative to glgC2 expression in WT. The mean and standard deviation of a representative experiment is shown.
Figure 4
Figure 4. Glycogen storage mutants exhibit growth defects during growth under high and low nitrogen conditions, corresponding to the period in the growth curve when glycogen accumulates
(A,C) Growth of WT, glgC1, glgC2, glgC1 glgC2 and glgX in M9-glucose in the presence of high nitrogen (A) or low nitrogen (C). Samples were grown at 37°C in M9-glucose with high or limiting ntirogen and the OD600 of each sample was read every 20 minutes for 10 hours. All samples were analyzed in triplicate. The mean OD600 and standard deviation at each time point from a representative experiment are shown. (B, D) Glycogen was assayed in WT V. cholerae during growth in M9-glucose in the presence of high (B) or low nitrogen (D). At each of the indicated time-points, samples were removed and the glycogen content was determined using the enzymatic hydrolysis assay. All samples were analyzed in triplicate. The mean and standard deviation of a representative experiment is shown.
Figure 5
Figure 5. Glycogen metabolism prolongs survival in nutrient poor environments
(A–B) M9 with no carbon source (A) or pond water (B) were inoculated with 106 cfu of a 1:1 mix of mutant (LacZ+) and wt (LacZ−) grown under nitrogen limiting conditions. At the indicated times, the ratio of viable bacteria was quantitated by blue:white colony screening. The competitive index (CI) is the ratio of mutant:wt corrected for the input ratio. Each data point is the geometric mean of the CI obtained from three independent samples, each done in triplicate. The asterisks indicate a significant decrease in the median CI compared to that from competitions between WT and glgC2 (*p<0.05 or ** p<0.001 using a One-way Anova). (C–F) Quantitation of glycogen in WT and glgX strains during incubation in M9 with no carbon source or in pond water as indicated. The inocula were grown under nitrogen limiting conditions. All samples were analyzed in triplicate. The mean and standard deviation at each time-point of a representative experiment is shown.
Figure 6
Figure 6. The glgC1 glgC2 mutant is attenuated for survival in cholera stool
Three stool supernatants were inoculated with a 1:1 mix of WT and glgC1 glgC2 (filled circles), or WT and glgX (open circles) and incubated statically at 37°C. After 2 hr, the ratio of mutant:wt bacteria was determined by blue:white colony screening. Each data point indicates the CI from a single competition experiment. The horizontal line indicates the geometric mean of each data set. The glgC1 glgC2 mutant is significantly attenuated for survival compared to the respective competition between WT and glgX in each stool sample using a two-tailed student’s t-test (*p<0.05 and ** p<0.001).
Figure 7
Figure 7. RpoS negatively regulates glycogen synthesis in V. cholerae
(A) Glycogen accumulation in WT and an rpoS mutant was quantified by enzymatically hydrolyzing glycogen stores into glucose monomers using amyloglucosidase during growth on low nitrogen M9 agar. The median and interquartile range of two independent experiments performed in quadruplicate are shown. An rpoS mutant was found to store significantly more glycogen than WT using a two-tailed student’s t-test (p=0.0014). (B) Quantitative RT-PCR (qRT-PCR) analysis of glgC1 and glgC2 expression during growth of WT and an rpoS mutant on M9-glucose under nitrogen limitation. Samples were collected during late- logarithmic growth (OD600 = 0.8). All samples were prepared in triplicate and expression levels were normalized to rpoB expression in each sample and expressed relative to glgC1 or glgC2 expression in WT. The mean and standard deviation of a representative experiment is shown. (C) M9 minimal media with no carbon source or pond water were inoculated with a 1:1 ratio of rpoS:wt that were grown under nitrogen limiting conditions. At the indicated time-points, bacteria were removed and differentiated by blue:white screening. Each data point is the geometric mean of the CI obtained from samples tested in quadruplicate. A representative experiment is shown.
Figure 8
Figure 8. Glycogen plays a role in the transmission of V. cholerae
(A) Competition assays were done using the infant mouse model of cholera. WT was competed against glgC1 glgC2 (filled shapes) or glgX (open shapes) following growth on rich media (LB, squares) or low nitrogen M9 followed by pond water passage for 3 h (triangles) or 24 h (upside down triangles). In vitro control competition assays, in which the pond water passaged bacteria were grown for 20 hr in M9-glucose at 37°C with aeration, are shown. The CI was determined by calculating the mutant:wt corrected for the input ratio. Each data point represents the CI from an individual mouse or in vitro competition. The horizontal line represents the geometric mean of each data set. glgC1 glgC2 and glgX are significantly attenuated for virulence compared to WT after pond water passage compared to the respective in vitro competition (*p<0.001 and **p<0.005, by a student’s two-tailed t-test). (B) Representative TEM images of stool V. cholerae obtained from three cholera patients. The percentage of glycogen positive V. cholerae in each stool sample is noted next to a representative TEM image. Scale bar = 0.5 μm. (C) qRT-PCR analysis of glgX expression in stool V. cholerae from three cholera patients after incubation in pond water for 0, 5 and 24 h. Expression of the glgX transcript relative to t=0 h is shown. Transcript amounts were normalized to either ftsQ or dnaQ.

References

    1. Alonso-Casajus N, Dauvillee D, Viale AM, Munoz FJ, Baroja-Fernandez E, Moran-Zorzano MT, Eydallin G, Ball S, Pozueta-Romero J. Glycogen phosphorylase, the product of the glgP Gene, catalyzes glycogen breakdown by removing glucose units from the nonreducing ends in Escherichia coli. J Bacteriol. 2006;188:5266–5272. - PMC - PubMed
    1. Andersson RA, Koiv V, Norman-Setterblad C, Pirhonen M. Role of RpoS in virulence and stress tolerance of the plant pathogen Erwinia carotovora subsp. carotovora. Microbiology. 1999;145(Pt 12):3547–3556. - PubMed
    1. Angelichio MJ, Spector J, Waldor MK, Camilli A. Vibrio cholerae intestinal population dynamics in the suckling mouse model of infection. Infect Immun. 1999;67:3733–3739. - PMC - PubMed
    1. Belanger AE, Hatfull GF. Exponential-phase glycogen recycling is essential for growth of Mycobacterium smegmatis. J Bacteriol. 1999;181:6670–6678. - PMC - PubMed
    1. Bonafonte MA, Solano C, Sesma B, Alvarez M, Montuenga L, Garcia-Ros D, Gamazo C. The relationship between glycogen synthesis, biofilm formation and virulence in salmonella enteritidis. FEMS Microbiol Lett. 2000;191:31–36. - PubMed

Publication types

MeSH terms