. 2009 Feb 18:9:41.
doi: 10.1186/1471-2148-9-41.

Evolution of the sugar receptors in insects

Affiliations

Evolution of the sugar receptors in insects

Lauren B Kent et al. BMC Evol Biol. .

Abstract

Background: Perception of sugars is an invaluable ability for insects which often derive quickly accessible energy from these molecules. A distinctive subfamily of eight proteins within the gustatory receptor (Gr) family has been identified as sugar receptors (SRs) in Drosophila melanogaster (Gr5a, Gr61a, and Gr64a-f). We examined the evolution of these SRs within the 12 available Drosophila genome sequences, as well as three mosquito, two moth, and beetle, bee, and wasp genome sequences.

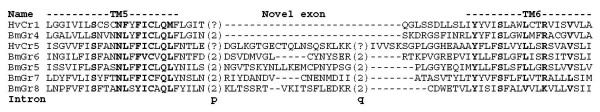
Results: While most Drosophila species retain all eight genes, we find that the three Drosophila subgenus species have lost Gr64d, while D. grimshawi and the D. pseudoobscura/persimilis sibling species have also lost Gr5a function. The entire Gr64 gene complex was also duplicated in the D. grimshawi lineage, but only one potentially functional copy of each gene has been retained. The numbers of SRs range from two in the hymenopterans Apis mellifera and Nasonia vitripennis to 16 in the beetle Tribolium castaneum. An unusual aspect is the evolution of a novel exon from intronic sequence in an expanded set of four SRs in Bombyx mori (BmGr5-8), which appears to be the first example of such exonization in insects. Twelve intron gains and 63 losses are inferred within the SR family.

Conclusion: Examination of the SRs in these fly, mosquito, moth, beetle, and hymenopteran genome sequences reveals that they appear to have originated independently from single ancestral genes within the dipteran and coleopteran lineages, and two genes in the lepidopteran and hymenopteran lineages. The origin of the insect SRs will eventually be illuminated by additional basal insect and arthropod genome sequences.


Figures

Figure 1
Figure 1
Phylogenetic relationships of eight SRs in 12 Drosophila species. This is a corrected distance tree based on aligned amino acids and rooted at the midpoint. The variable length and sequence N-termini upstream of the conserved "pre-peak" region (Figures 7, 8, 9, 10, 11, 12 and 13) were removed from the alignment. Species names are abbreviated to the genus plus the first three letters of the species name, and are color-coded. The eight proteins are indicated on the right. Bootstrap support from 1000 replications of uncorrected distance analysis is shown for the major branches. Most orthologous relationships are in accordance with the known species relationships, or near enough, and bootstrap support is not shown for them. Intron losses are shown in lower case light blue letters above the branches to which they map, but only if not shown in Figure 3.
Figure 2
Figure 2
Schematic diagram of the two SR gene complexes in D. grimshawi. The two complexes and their genes are labeled 1 and 2 for the centromeric and telomeric complexes, with intact genes shown as solid boxes, pseudogenes as grey boxes, and pseudogenic gene fragments as short grey boxes. Direction of transcription is shown by arrow heads. Paralogy is indicated by dashed lines. Not to scale.
Figure 3
Figure 3
Phylogenetic relationships of SRs in insects. This corrected distance tree was rooted with the AmGr2/NvGr2 and HvCr5/BmGr4 lineage as the outgroup, based on their apparent basal clustering in larger analyses of the entire Gr family. Bootstrap support above 50% from 1000 replications of full heuristic uncorrected distance analysis, 1000 bootstrap replications of full heuristic maximum parsimony analysis, and 25000 maximum likelihood quartet puzzling steps are shown above relevant branches. Intron gains and losses are indicated by light blue upper case and lower case letters, respectively, above branches to which they are mapped by simple presence-absence Dollo parsimony. Drosophila SRs are shown in shades of red, mosquito green, beetle brown, moth blue, and hymenopteran purple. Only the D. pseudoobscura SRs are included along with those from D. melanogaster to help balance the dipteran SR analysis. Inferred orthologous relationships within the three mosquito species are indicated by bars on the right. The large orange 1 and purple 2's indicate the two major tandem duplications hypothesized at the base of the dipteran SR evolution (see Figure 4). The blue 3 indicates the origin of the novel exon and hence also intron "q" in the expanded moth SR lineage.
Figure 4
Figure 4
Model for the evolution of the SR genes in flies. Schematic diagram showing conservation of microsynteny of sugar Grs in Drosophila melanogaster (blue), Anopheles gambiae (red), Aedes aegypti (green) and Culex pipiens (yellow). Most of the genes share both phylogenetic relatedness and similar placement in chromosomes (Ae. gambiae and D. melanogaster) and supercontigs (Ae. aegypti and C. pipiens) across the four species, even after duplication events (shown with line 1 and lines 2, as in Fig. 3). Although it appears that some genes have moved within their respective genomes in D. melanogaster and An. gambiae (shown with grey arrows), their phylogenetic relationships (Fig. 3) reveal where they most likely had previously resided on the chromosomes. Likewise, it appears that there has been some level of gene shuffling in Ae. aegypti and C. pipiens (shown with pink arrows) with respect to the arrangements seen in D. melanogaster and An. gambiae. Although the genes have not yet been mapped to Aedes and Culex chromosomes, the ordered supercontigs of the genome sequences are likely accurate representations of microsynteny in each species.
Figure 5
Figure 5
A novel exon in BmGr5-8. The amino acids of the TM5 and TM6 regions encoded by the ends of the exons flanking the novel exon are shown aligned with each other for the seven moth SRs. Amino acids shared by at least six of the sequences are highlighted in bold font. Like other SRs, BmGr4 does not have the novel exon, and the same is predicted for HvCr1. The location of the phase 2 intron in BmGr4 (intron p in Figure 6) is shown. BmGr5-8 have a short novel exon encoding 15–20 unconserved amino acids, and an additional flanking phase 2 intron (intron q in Figure 6). HvCr5 is predicted to have an intron q, however the precise location cannot be predicted.
Figure 6
Figure 6
Intron locations and phases in the insect SR genes. Introns are named in an alphabetical series from 5' to 3' ends of the genes, positioned above a line representing a 450aa SR, with the longer N-terminus typical of the DmGr5a and 64e/f lineage. Hence the coordinates of the introns are ~20 aa later than those shown in Figure 4 of Robertson et al. [5]. Correspondence between intron names in Robertson et al. [5] and those herein is: a/a, b/b, d/f, j/h, o/j, r/m, y/o, a'/p, 2/r, 3/s. Intron phase is shown below the line (0 is between codons, 1 is after the first codon position, and 2 after the second codon position).
Figure 7
Figure 7
Multiple alignment of the insect SRs. This is the CLUSTALX alignment employed for the phylogenetic analysis in Figure 3, except that positions of uncertain alignment and large gaps, specifically alignment positions 1–82, 150–160, 209–219, 340–355, 405–435, and 531–559, were excluded from the phylogenetic analysis. The Xs at the start of some sequences were added to facilitate splitting the figure into six convenient parts. Alignment positions are shown at the bottom, along with the "conservation" histogram from CLUSTALX. The predicted TM domains are evident as vertical bands of hydrophobic amino acids shaded blue, and the "pre-peak" is approximately alignment positions 84–103, TM1 is 121–142, TM2 is 161–189, TM3 is 224–234, TM4 is 291–314, TM5 is 378–398, TM6 is 438–457, and TM7 is 511–529.
Figure 8
Figure 8
Multiple alignment of the insect SRs. This is the CLUSTALX alignment employed for the phylogenetic analysis in Figure 3, except that positions of uncertain alignment and large gaps, specifically alignment positions 1–82, 150–160, 209–219, 340–355, 405–435, and 531–559, were excluded from the phylogenetic analysis. The Xs at the start of some sequences were added to facilitate splitting the figure into six convenient parts. Alignment positions are shown at the bottom, along with the "conservation" histogram from CLUSTALX. The predicted TM domains are evident as vertical bands of hydrophobic amino acids shaded blue, and the "pre-peak" is approximately alignment positions 84–103, TM1 is 121–142, TM2 is 161–189, TM3 is 224–234, TM4 is 291–314, TM5 is 378–398, TM6 is 438–457, and TM7 is 511–529.
Figure 9
Figure 9
Multiple alignment of the insect SRs. This is the CLUSTALX alignment employed for the phylogenetic analysis in Figure 3, except that positions of uncertain alignment and large gaps, specifically alignment positions 1–82, 150–160, 209–219, 340–355, 405–435, and 531–559, were excluded from the phylogenetic analysis. The Xs at the start of some sequences were added to facilitate splitting the figure into six convenient parts. Alignment positions are shown at the bottom, along with the "conservation" histogram from CLUSTALX. The predicted TM domains are evident as vertical bands of hydrophobic amino acids shaded blue, and the "pre-peak" is approximately alignment positions 84–103, TM1 is 121–142, TM2 is 161–189, TM3 is 224–234, TM4 is 291–314, TM5 is 378–398, TM6 is 438–457, and TM7 is 511–529.
Figure 10
Figure 10
Multiple alignment of the insect SRs. This is the CLUSTALX alignment employed for the phylogenetic analysis in Figure 3, except that positions of uncertain alignment and large gaps, specifically alignment positions 1–82, 150–160, 209–219, 340–355, 405–435, and 531–559, were excluded from the phylogenetic analysis. The Xs at the start of some sequences were added to facilitate splitting the figure into six convenient parts. Alignment positions are shown at the bottom, along with the "conservation" histogram from CLUSTALX. The predicted TM domains are evident as vertical bands of hydrophobic amino acids shaded blue, and the "pre-peak" is approximately alignment positions 84–103, TM1 is 121–142, TM2 is 161–189, TM3 is 224–234, TM4 is 291–314, TM5 is 378–398, TM6 is 438–457, and TM7 is 511–529.
Figure 11
Figure 11
Multiple alignment of the insect SRs. This is the CLUSTALX alignment employed for the phylogenetic analysis in Figure 3, except that positions of uncertain alignment and large gaps, specifically alignment positions 1–82, 150–160, 209–219, 340–355, 405–435, and 531–559, were excluded from the phylogenetic analysis. The Xs at the start of some sequences were added to facilitate splitting the figure into six convenient parts. Alignment positions are shown at the bottom, along with the "conservation" histogram from CLUSTALX. The predicted TM domains are evident as vertical bands of hydrophobic amino acids shaded blue, and the "pre-peak" is approximately alignment positions 84–103, TM1 is 121–142, TM2 is 161–189, TM3 is 224–234, TM4 is 291–314, TM5 is 378–398, TM6 is 438–457, and TM7 is 511–529.
Figure 12
Figure 12
Multiple alignment of the insect SRs. This is the CLUSTALX alignment employed for the phylogenetic analysis in Figure 3, except that positions of uncertain alignment and large gaps, specifically alignment positions 1–82, 150–160, 209–219, 340–355, 405–435, and 531–559, were excluded from the phylogenetic analysis. The Xs at the start of some sequences were added to facilitate splitting the figure into six convenient parts. Alignment positions are shown at the bottom, along with the "conservation" histogram from CLUSTALX. The predicted TM domains are evident as vertical bands of hydrophobic amino acids shaded blue, and the "pre-peak" is approximately alignment positions 84–103, TM1 is 121–142, TM2 is 161–189, TM3 is 224–234, TM4 is 291–314, TM5 is 378–398, TM6 is 438–457, and TM7 is 511–529.
Figure 13
Figure 13
Multiple alignment of the insect SRs. This is the CLUSTALX alignment employed for the phylogenetic analysis in Figure 3, except that positions of uncertain alignment and large gaps, specifically alignment positions 1–82, 150–160, 209–219, 340–355, 405–435, and 531–559, were excluded from the phylogenetic analysis. The Xs at the start of some sequences were added to facilitate splitting the figure into six convenient parts. Alignment positions are shown at the bottom, along with the "conservation" histogram from CLUSTALX. The predicted TM domains are evident as vertical bands of hydrophobic amino acids shaded blue, and the "pre-peak" is approximately alignment positions 84–103, TM1 is 121–142, TM2 is 161–189, TM3 is 224–234, TM4 is 291–314, TM5 is 378–398, TM6 is 438–457, and TM7 is 511–529.
Figure 14
Figure 14
Hydropathy plot and predicted TM domains for AmGr2. Regions of hydrophobic amino acids yield stretches of positive hydropathy, and these are predicted to be TM domains by the ConPredII prediction program (indicated by thick green bars).
Figure 15
Figure 15
Predicted membrane topology for AmGr2. ConPredII predicts eight TM domains for this protein and many other SRs, usually as here with the N-terminus internal and the C-terminus external.

References

    1. Clyne PJ, Warr CG, Carlson JR. Candidate taste receptors in Drosophila. Science. 2000;287:1830–1834. doi: 10.1126/science.287.5459.1830. - DOI - PubMed
    1. Scott K, Brady R, Jr, Cravchik A, Morozov P, Rzhetsky A, Zuker C, Axel R. A Chemosensory Gene Family Encoding Candidate Gustatory and Olfactory Receptors in Drosophila. Cell. 2001;104:661–673. doi: 10.1016/S0092-8674(01)00263-X. - DOI - PubMed
    1. Dunipace L, Meister S, McNealy C, Amrein H. Spatially restricted expression of candidate taste receptors in the Drosophila gustatory system. Current Biology. 2001;11:822–835. doi: 10.1016/S0960-9822(01)00258-5. - DOI - PubMed
    1. Chyb S, Dahanukar A, Wickens A, Carlson JR. Drosophila Gr5a encodes a taste receptor tuned to trehalose. PNAS. 2003;100:14526–14530. doi: 10.1073/pnas.2135339100. - DOI - PMC - PubMed
    1. Robertson H, Warr CG, Carlson JR. Molecular evolution of the insect chemoreceptor gene superfamily in Drosophila melanogaster. PNAS. 2003;100:14537–14542. doi: 10.1073/pnas.2335847100. - DOI - PMC - PubMed

Publication types

Substances

LinkOut - more resources