. 2009 Feb 15;15(4):1192-8.
doi: 10.1158/1078-0432.CCR-08-2150.

Combining the endoplasmic reticulum stress-inducing agents bortezomib and fenretinide as a novel therapeutic strategy for metastatic melanoma

Affiliations

Combining the endoplasmic reticulum stress-inducing agents bortezomib and fenretinide as a novel therapeutic strategy for metastatic melanoma

David S Hill et al. Clin Cancer Res. .

Abstract

Purpose: Single-agent chemotherapy is largely the treatment of choice for systemic therapy of metastatic melanoma, but survival rates are low, and novel adjuvant and systemic therapies are urgently required. Endoplasmic reticulum (ER) stress is a potential therapeutic target, and two relatively new drugs, fenretinide and bortezomib (Velcade), each acting via different cellular mechanisms, induce ER stress leading to apoptosis in melanoma cells. The aim of this study was to test the hypothesis that apoptosis of melanoma cells may be increased by combining clinically achievable concentrations of fenretinide and bortezomib.

Experimental design: Three human melanoma cell lines were used to assess changes in viability and the induction of apoptosis in response to fenretinide, bortezomib, or both drugs together. A s.c. xenograft model was used to test responses in vivo.

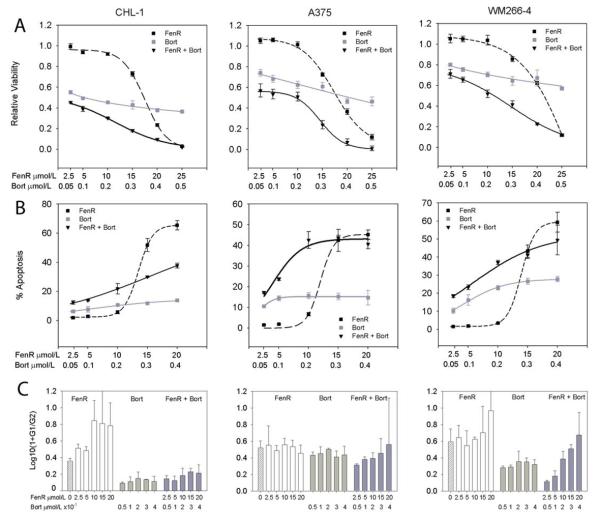
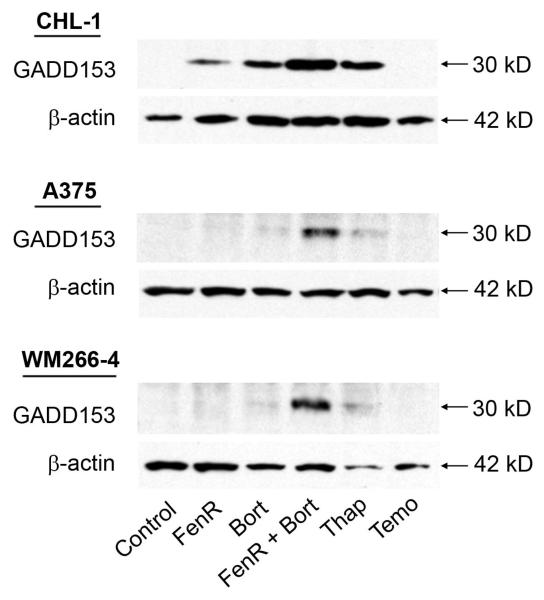
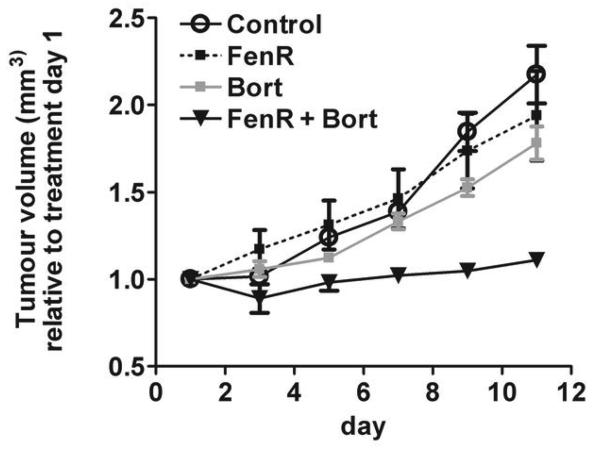
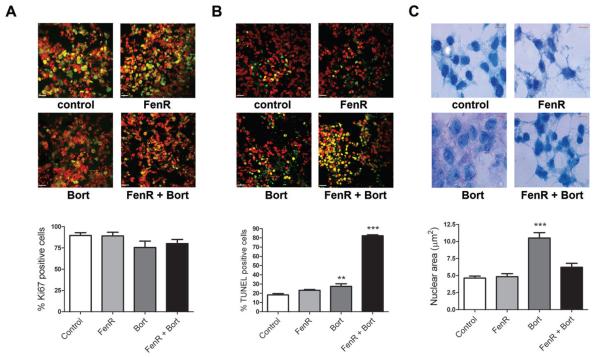
Results: Fenretinide and bortezomib synergistically decreased viability and increased apoptosis in all three melanoma lines at clinically achievable concentrations. This was also reflected by increased expression of GADD153, a marker of ER stress-induced apoptosis. In vivo, fenretinide in combination with bortezomib gave a marked reduction in xenograft tumor volume and an increase in apoptosis compared with fenretinide or bortezomib alone. The cell cycle stage of tumor cells in vivo were similar to that predicted from the effects of each drug or the combination in vitro.

Conclusions: These results suggest that fenretinide and bortezomib, both of which are available in clinical formulation, warrant clinical evaluation as a combination therapy for metastatic melanoma.


Figures

Figure 1
Figure 1
Synergistic effects of fenretinide with bortezomib. Row A, viability (MTS assay) relative to control cells (Relative Viability); row B, % apoptosis and row C, the mean ratio (+95% confidence interval) of G0+G1 to G2+M cells (G1/G2) of CHL-1 (left column), A375 (centre column) and WM266-4 cells (right column) after 24 h treatment with fenretinide (FenR), bortezomib (Bort) or both agents combined at a fixed dose ratio of 50:1 (fenretinide:bortezomib). The highest doses used for the viability experiments were 25 μmol/L for fenretinide and 0.5 μmol/L for bortezomib, but apoptosis and cell cycle parameters were not analysed at these dose levels because the high levels of cell death made the measurements unreliable. In row A and B, each point is the mean of 8 replicates for viability and 3 for apoptosis experiments ± 95% confidence intervals. Sigmoidal curves (3- or 4-parameter) were fitted to the data using Sigmaplot (Systat Software Inc., San Jose, CA). In row C, the data were derived from flow cytometry analysis of PI-stained cells and expressed as the transformation Log10(1+G1/G2) (Ordinate). Bar heights are means + 95% confidence intervals. The hatched bars (first bar in each graph) in row C are data for control cells; open bars, fenretinide treatment; light gray bars, bortezomib; dark gray bars, fenretinide and bortezomib combined. Bortezomib substantially reduced the G1/G2 ratio in all three cell lines (one-way ANOVA, Dunnett's test, compared to control, P<0.001 for CHL1 and WM266-4 cells and for A375 cells P≤0.05 for all except the 0.2 μmol/L treatment) but there was no dose-dependent relationship (GLM: F5,39=132, P<0.001; main effect cell type F2,39=101, P<0.001, but dose [excluding control; covariate term] and the cell-type*dose interaction terms were non-significant, F<1.94, P>0.15). The effect of fenretinide was dose dependent (GLM for CHL-1 and WM266-4 cells: no difference with respect to cell type F1,32=2.13, P=0.154 or cell type*dose interaction F1,32=1.06, P=0.31, but a significant dose effect F1,32=36.7, P<0.001). For the combined treatment, there was a dose-dependent increase in G1/G2 ratio (GLM, cell type, dose covariate and cell type*dose interaction terms all significant F>16, P≤0.001) and data analysis for each cell line separately also showed a significant linear increase in G1/G2 ratio with increasing doses of fenretinide and bortezomib together (linear contrasts on one-way ANOVA, F1,10≥8.7, P≤0.014).
Figure 2
Figure 2
Western blot analysis for the induction of GADD153 or β-actin (loading control) in CHL-1, A375 or WM266-4 cells after 18 h treatment with 10 μmol/L fenretinide (FenR), 0.2 μmol/L bortezomib (Bort), or combined treatment with both agents (10 μmol/L FenR and 0.2 μmol/L bortezomib [FenR + Bort]), in comparison to cells treated with either 7.5 μmol/L thapsigargin (Thap; a positive control for ER stress induction), 1 mmol/L temozolomide (Temo; an agent that induces apoptosis via DNA damage and not ER stress as a negative control) or control vehicle (Control).
Figure 3
Figure 3
Inhibition of tumor growth in xenograft tumors established from human A375 melanoma cells. Relative tumor volume after daily treatment with 1.45 mg/kg fenretinide (FenR), 0.1 mg/kg bortezomib (Bort) or both agents combined (FenR + Bort). Each point is the mean from 6 tumors ± SEM and is expressed relative to the tumor volume on day 1 of treatment. Ordinate, tumour volume (mm3) relative to treatment on day 1; abscissa, day of treatment (day).
Figure 4
Figure 4
Immunohistochemical analysis of A375 xenograft tumors treated with fenretinide and/or bortezomib. Panels A, B and C are micrographs of tumor sections stained with (A) Ki67, (B) TUNEL or (C) methylene blue, from animals treated for 10 days with 1.45 mg/kg fenretinide (FenR), 0.1 mg/kg bortezomib (Bort) or both agents together (FenR+Bort). In A and B, red is the TOTO-3 iodide counterstain, green is staining for Ki67 or TUNEL, respectively, and yellow is the signal from Ki67 or TUNEL staining on a cellular background. The bar graphs below each set of micrographs summarise the data analysis from tumor sections. For Ki67 (A) and TUNEL staining (B) each bar is the mean % + SEM of positive-stained cells (from at east 2100 cells from 3 independent staining runs) from 6 tumors in each treatment group. In the graph for B, ** indicates significantly different from control (Dunnett's; P<0.01) and *** indicates significantly different from control and bortezomib alone (Dunnett's and ANOVA contrast, P<0.001). For methylene blue staining (C), bar heights are the mean (6 tumors per treatment group) +SEM nuclear area (μm2) of 200 nuclei from 4 independent staining experiments, in all cases assessed by two independent observers; *** indicates significantly different from control (Dunnett's, P<0.001); all other treatments were not significantly different from control. Scale bars represent 100 μm for Ki67 and TUNEL staining (white bars) and 5 μm for methylene blue staining (red bars).

Similar articles

Cited by

References

    1. Thompson JF, Scolyer RA, Kefford RF. Cutaneous Melanoma. Lancet. 2005;365:687–701. - PubMed
    1. Rass K, Tilgen W. Treatment of melanoma and non melanoma skin cancer. Adv Exp Med Biol. 2008;624:296–318. - PubMed
    1. Atallah E, Flaherty L. Treatment of metastatic maliganant melanoma. Current Treatment Options in Oncology. 2005;6:185–93. - PubMed
    1. Quirt I, Verma S, Petrella T, Bak K, Charette M. Temozolomide for the treatment of metastatic melanoma: a systemic review. Oncologist. 2007;12:1114–23. - PubMed
    1. Xiao C, Yang BF, Song JH, Schulman H, Li L, Hao C. Inhibition of CaMKII-mediated c-FLIP expression sensitizes malignant melanoma cells to TRAIL-induced apoptosis. Exp Cell Res. 2005;304:244–55. - PubMed

Publication types

MeSH terms