

A genetic expression profile associated with oral cancer identifies a group of patients at high risk of poor survival
- PMID: 19228736
- PMCID: PMC2683360
- DOI: 10.1158/1078-0432.CCR-08-1816
A genetic expression profile associated with oral cancer identifies a group of patients at high risk of poor survival
Abstract
Purpose: To determine if gene expression signature of invasive oral squamous cell carcinoma (OSCC) can subclassify OSCC based on survival.
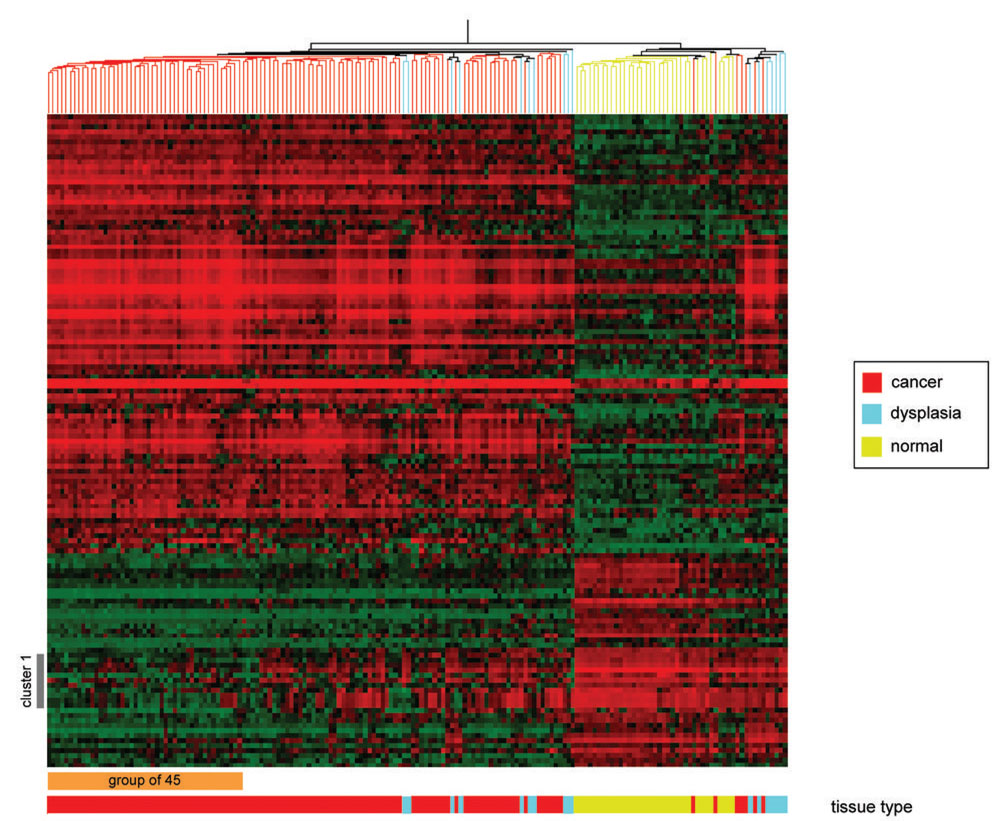
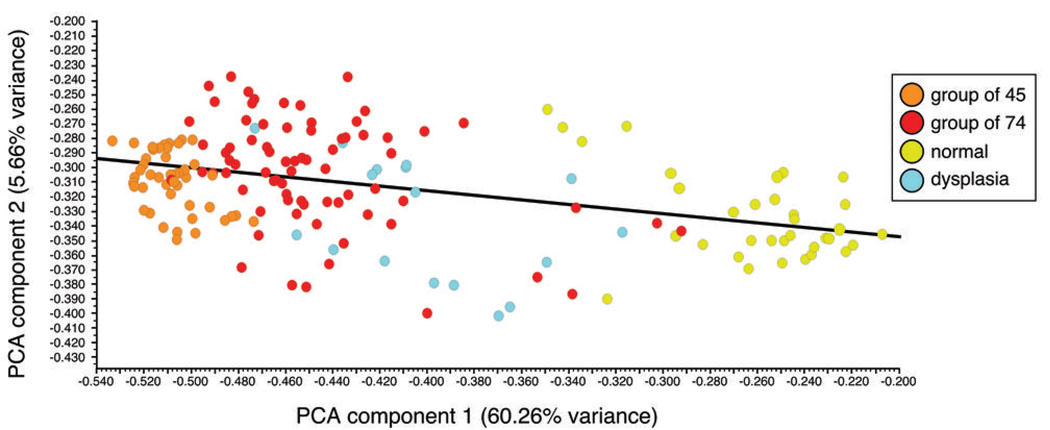
Experimental design: We analyzed the expression of 131 genes in 119 OSCC, 35 normal, and 17 dysplastic mucosa to identify cluster-defined subgroups. Multivariate Cox regression was used to estimate the association between gene expression and survival. By stepwise Cox regression, the top predictive models of OSCC-specific survival were determined and compared by receiver operating characteristic analysis.
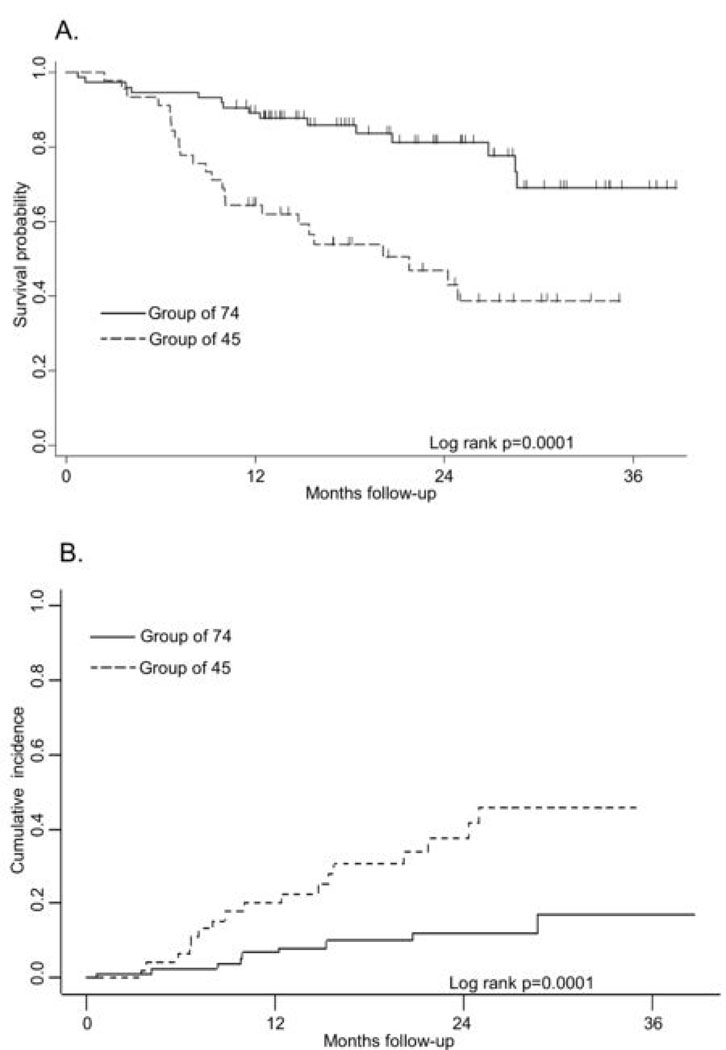
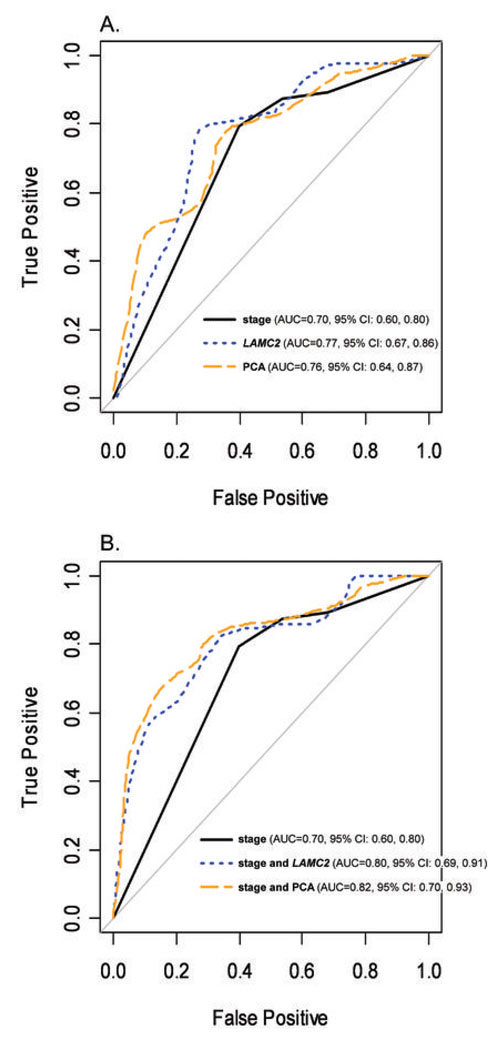
Results: The 3-year overall mean+/-SE survival for a cluster of 45 OSCC patients was 38.7+/-0.09% compared with 69.1+/-0.08% for the remaining patients. Multivariate analysis adjusted for age, sex, and stage showed that the 45 OSCC patient cluster had worse overall and OSCC-specific survival (hazard ratio, 3.31; 95% confidence interval, 1.66-6.58 and hazard ratio, 5.43; 95% confidence interval, 2.32-12.73, respectively). Stepwise Cox regression on the 131 probe sets revealed that a model with a term for LAMC2 (laminin gamma2) gene expression best identified patients with worst OSCC-specific survival. We fit a Cox model with a term for a principal component analysis-derived risk score marker and two other models that combined stage with either LAMC2 or PCA. The area under the curve for models combining stage with either LAMC2 or PCA was 0.80 or 0.82, respectively, compared with 0.70 for stage alone (P=0.013 and 0.008, respectively).
Conclusions: Gene expression and stage combined predict survival of OSCC patients better than stage alone.
Figures
Similar articles
-
Integrative analysis of DNA copy number and gene expression in metastatic oral squamous cell carcinoma identifies genes associated with poor survival.Mol Cancer. 2010 Jun 11;9:143. doi: 10.1186/1476-4598-9-143. Mol Cancer. 2010. PMID: 20537188 Free PMC article.
-
A Five-mRNA Expression Signature to Predict Survival in Oral Squamous Cell Carcinoma by Integrated Bioinformatic Analyses.Genet Test Mol Biomarkers. 2021 Aug;25(8):517-527. doi: 10.1089/gtmb.2021.0066. Genet Test Mol Biomarkers. 2021. PMID: 34406843 Free PMC article.
-
A 13-gene signature prognostic of HPV-negative OSCC: discovery and external validation.Clin Cancer Res. 2013 Mar 1;19(5):1197-203. doi: 10.1158/1078-0432.CCR-12-2647. Epub 2013 Jan 14. Clin Cancer Res. 2013. PMID: 23319825 Free PMC article.
-
Gene expression profiling identifies genes predictive of oral squamous cell carcinoma.Cancer Epidemiol Biomarkers Prev. 2008 Aug;17(8):2152-62. doi: 10.1158/1055-9965.EPI-07-2893. Epub 2008 Jul 31. Cancer Epidemiol Biomarkers Prev. 2008. PMID: 18669583 Free PMC article.
-
Ultra-deep targeted sequencing of advanced oral squamous cell carcinoma identifies a mutation-based prognostic gene signature.Oncotarget. 2015 Jul 20;6(20):18066-80. doi: 10.18632/oncotarget.3768. Oncotarget. 2015. PMID: 25980437 Free PMC article.
Cited by
-
Tumor Suppressor LINC02487 Inhibits Oral Squamous Cell Carcinoma Cell Migration and Invasion Through the USP17-SNAI1 Axis.Front Oncol. 2020 Oct 29;10:559808. doi: 10.3389/fonc.2020.559808. eCollection 2020. Front Oncol. 2020. PMID: 33194625 Free PMC article.
-
Integrative analysis of DNA copy number and gene expression in metastatic oral squamous cell carcinoma identifies genes associated with poor survival.Mol Cancer. 2010 Jun 11;9:143. doi: 10.1186/1476-4598-9-143. Mol Cancer. 2010. PMID: 20537188 Free PMC article.
-
SERPINE1 and SMA expression at the invasive front predict extracapsular spread and survival in oral squamous cell carcinoma.Br J Cancer. 2014 Nov 25;111(11):2114-21. doi: 10.1038/bjc.2014.500. Epub 2014 Sep 30. Br J Cancer. 2014. PMID: 25268377 Free PMC article.
-
Keratinization-associated miR-7 and miR-21 regulate tumor suppressor reversion-inducing cysteine-rich protein with kazal motifs (RECK) in oral cancer.J Biol Chem. 2012 Aug 24;287(35):29261-72. doi: 10.1074/jbc.M112.366518. Epub 2012 Jul 2. J Biol Chem. 2012. PMID: 22761427 Free PMC article. Clinical Trial.
-
LINC00472 suppresses oral squamous cell carcinoma growth by targeting miR-455-3p/ELF3 axis.Bioengineered. 2022 Jan;13(1):1162-1173. doi: 10.1080/21655979.2021.2018092. Bioengineered. 2022. PMID: 35258410 Free PMC article.
References
-
- Carvalho AL, Nishimoto IN, Califano JA, Kowalski LP. Trends in incidence and prognosis for head and neck cancer in the United States: A site-specific analysis of the SEER database. Int J Cancer. 2005;114:806–816. - PubMed
-
- Méndez E, Cheng C, Farwell DG, et al. Transcriptional expression profiles of oral squamous cell carcinomas. Cancer. 2002;95:1482–1494. - PubMed
-
- Baatenburg de Jong RJ, Hermans J, Molenaar J, Briaire JJ, le Cessie S. Prediction of survival in patients with head and neck cancer. Head Neck. 2001;23:718–724. - PubMed
-
- Chung CH, Parker JS, Karaca G, et al. Molecular classification of head and neck squamous cell carcinomas using patterns of gene expression. Cancer Cell. 2004;5:489–500. - PubMed
-
- Chung CH, Parker JS, Ely K, et al. Gene Expression Profiles Identify Epithelial-to-Mesenchymal Transition and Activation of Nuclear Factor-{kappa}B Signaling as Characteristics of a High-risk Head and Neck Squamous Cell Carcinoma. Cancer Res. 2006;66:8210–8218. - PubMed
Publication types
MeSH terms
Grants and funding
LinkOut - more resources
Full Text Sources
Other Literature Sources
Medical
