Mantle cell lymphoma cells express high levels of CXCR4, CXCR5, and VLA-4 (CD49d): importance for interactions with the stromal microenvironment and specific targeting
- PMID: 19228923
- PMCID: PMC4969050
- DOI: 10.1182/blood-2008-10-185827
Mantle cell lymphoma cells express high levels of CXCR4, CXCR5, and VLA-4 (CD49d): importance for interactions with the stromal microenvironment and specific targeting
Abstract
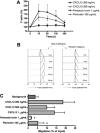
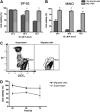
Mantle cell lymphoma (MCL) is characterized by an early, widespread dissemination and residual disease after conventional treatment, but the mechanisms responsible for lymphoma cell motility and drug resistance are largely unknown. There is growing evidence suggesting that chemokine receptors and adhesion molecules are critical for malignant B-cell trafficking and homing to supportive tissue microenvironments, where they receive survival and drug resistance signals. Therefore, we examined chemokine receptor and adhesion molecule expression and function in MCL cells and their importance for migration and adhesion to marrow stromal cells (MSCs). We found that MCL cells display high levels of functional CXCR4 and CXCR5 chemokine receptors and VLA-4 adhesion molecules. We also report that MCL cells adhere and spontaneously migrate beneath MSCs in a CXCR4- and VLA-4-dependent fashion (pseudoemperipolesis). Moreover, we demonstrate that MSCs confer drug resistance to MCL cells, particularly to MCL cells that migrate beneath MSC. To target MCL-MSC interactions, we tested Plerixafor, a CXCR4 antagonist, and natalizumab, a VLA-4 antibody. Both agents blocked functional responses to the respective ligands and inhibited adhesive interactions between MCL cells and MSCs. These findings provide a rationale to further investigate the therapeutic potential of these drugs in MCL.
Figures


 ), compared with MCL in suspension and without stromal cell support (
 ). Results are presented as mean relative viability compared with untreated controls (100%) and are the mean ± SEM of triplicates. *Protection of MCL cells from 4-HC-induced cytotoxicity with significantly higher viabilities compared with controls (P < .05). (C) Contour plots that depict the viability of MINO MCL cells, as detected by staining with DiOC6 and PI after 24 hours of culture with 10 μM 4-HC, in the presence or absence of M2-10B4 stromal cells, as indicated above each of the plots. The proportion of viable cells is indicated above each of the gates that define viable cells by bright DiOC6 staining and PI exclusion.
Similar articles
-
ROS-Induced CXCR4 Signaling Regulates Mantle Cell Lymphoma (MCL) Cell Survival and Drug Resistance in the Bone Marrow Microenvironment via Autophagy.Clin Cancer Res. 2016 Jan 1;22(1):187-99. doi: 10.1158/1078-0432.CCR-15-0987. Epub 2015 Sep 8. Clin Cancer Res. 2016. PMID: 26350264 Free PMC article.
-
Hedgehog inhibitors selectively target cell migration and adhesion of mantle cell lymphoma in bone marrow microenvironment.Oncotarget. 2016 Mar 22;7(12):14350-65. doi: 10.18632/oncotarget.7320. Oncotarget. 2016. PMID: 26885608 Free PMC article.
-
SDF-1/CXCR4 and VLA-4 interaction regulates homing in Waldenstrom macroglobulinemia.Blood. 2008 Jul 1;112(1):150-8. doi: 10.1182/blood-2007-12-129395. Epub 2008 Apr 30. Blood. 2008. PMID: 18448868 Free PMC article.
-
The microenvironment in mantle cell lymphoma: cellular and molecular pathways and emerging targeted therapies.Semin Cancer Biol. 2011 Nov;21(5):308-12. doi: 10.1016/j.semcancer.2011.09.006. Epub 2011 Sep 18. Semin Cancer Biol. 2011. PMID: 21945516 Review.
-
Dissecting the role of the CXCL12/CXCR4 axis in acute myeloid leukaemia.Br J Haematol. 2020 Jun;189(5):815-825. doi: 10.1111/bjh.16456. Epub 2020 Mar 5. Br J Haematol. 2020. PMID: 32135579 Review.
Cited by
-
Chemically programmed bispecific antibodies that recruit and activate T cells.J Biol Chem. 2012 Aug 17;287(34):28206-14. doi: 10.1074/jbc.M112.384594. Epub 2012 Jul 3. J Biol Chem. 2012. PMID: 22761439 Free PMC article.
-
Shaping of the tumor microenvironment: Stromal cells and vessels.Semin Cancer Biol. 2015 Oct;34:3-13. doi: 10.1016/j.semcancer.2015.03.002. Epub 2015 Mar 18. Semin Cancer Biol. 2015. PMID: 25794825 Free PMC article. Review.
-
Molecular imaging of chemokine receptor CXCR4.Theranostics. 2013;3(1):76-84. doi: 10.7150/thno.4835. Epub 2013 Jan 15. Theranostics. 2013. PMID: 23382787 Free PMC article. Review.
-
Role of chemokine network in the development and progression of ovarian cancer: a potential novel pharmacological target.J Oncol. 2010;2010:426956. doi: 10.1155/2010/426956. Epub 2009 Dec 14. J Oncol. 2010. PMID: 20049170 Free PMC article.
-
Tipping the balance: toward rational combination therapies to overcome venetoclax resistance in mantle cell lymphoma.Leukemia. 2022 Sep;36(9):2165-2176. doi: 10.1038/s41375-022-01627-9. Epub 2022 Jun 20. Leukemia. 2022. PMID: 35725771 Free PMC article. Review.
References
-
- Fisher RI, Dahlberg S, Nathwani BN, Banks PM, Miller TP, Grogan TM. A clinical analysis of two indolent lymphoma entities: mantle cell lymphoma and marginal zone lymphoma (including the mucosa-associated lymphoid tissue and monocytoid B-cell subcategories). A Southwest Oncology Group study. Blood. 1995;85:1075–1082. - PubMed
-
- O'Connor OA. Mantle cell lymphoma: identifying novel molecular targets in growth and survival pathways. Hematology Am Soc Hematol Educ Program. 2007:270–276. - PubMed
-
- Raffeld M, Jaffe ES. bcl-1, t(11;14), and mantle cell-derived lymphomas. Blood. 1991;78:259–263. - PubMed
-
- Bosch F, Jares P, Campo E, et al. PRAD-1/cyclin D1 gene overexpression in chronic lymphoproliferative disorders: a highly specific marker of mantle cell lymphoma. Blood. 1994;84:2726–2732. - PubMed
-
- Argatoff LH, Connors JM, Klasa RJ, Horsman DE, Gascoyne RD. Mantle cell lymphoma: a clinicopathologic study of 80 cases. Blood. 1997;89:2067–2078. - PubMed
Publication types
MeSH terms
Substances
LinkOut - more resources
Full Text Sources

