. 2009 May 7;113(19):e1-9.
doi: 10.1182/blood-2008-06-162958. Epub 2009 Feb 19.

A HaemAtlas: characterizing gene expression in differentiated human blood cells

Affiliations

A HaemAtlas: characterizing gene expression in differentiated human blood cells

Nicholas A Watkins et al. Blood. .

Abstract

Hematopoiesis is a carefully controlled process that is regulated by complex networks of transcription factors that are, in part, controlled by signals resulting from ligand binding to cell-surface receptors. To further understand hematopoiesis, we have compared gene expression profiles of human erythroblasts, megakaryocytes, B cells, cytotoxic and helper T cells, natural killer cells, granulocytes, and monocytes using whole genome microarrays. A bioinformatics analysis of these data was performed focusing on transcription factors, immunoglobulin superfamily members, and lineage-specific transcripts. We observed that the numbers of lineage-specific genes varies by 2 orders of magnitude, ranging from 5 for cytotoxic T cells to 878 for granulocytes. In addition, we have identified novel coexpression patterns for key transcription factors involved in hematopoiesis (eg, GATA3-GFI1 and GATA2-KLF1). This study represents the most comprehensive analysis of gene expression in hematopoietic cells to date and has identified genes that play key roles in lineage commitment and cell function. The data, which are freely accessible, will be invaluable for future studies on hematopoiesis and the role of specific genes and will also aid the understanding of the recent genome-wide association studies.


Figures

Figure 1
Figure 1
Cells were purified to more than 95% purity as assessed by morphology and flow cytometry. After cell isolation, an aliquot of purified cells was removed and assessed for purity as described. Example of CD19+ B cells isolated from peripheral blood mononuclear cells. (A) Peripheral blood mononuclear cells assessed by Romanovsky-stained cytocentrifuge preparations and (B) phycoerythrin-labeled anti-CD19 by flow cytometry. After purification, more than 98% of cells were CD19+ as assessed by (C) a 1000 differential cell count of Romanovsky-stained cytocentrifuge preparations and (D) flow cytometry. Images and purity levels are representative of all samples processed. (A,C) Romanovsky-stained samples were visualized using an Olympus BX51 microscope (Olympus, Tokyo, Japan) with a 100×/1.30 oil objective and immersion oil (nd 1.516; Olympus). Images were captured using a Pixera Pro600ES and Penguin/Pro Application Suite version 3.0.1 (Pixera, Los Gatos, CA).
Figure 2
Figure 2
Characterization of blood cell transcriptomes and identification of differentially expressed transcripts. (A) Numbers of genes detected as present in different blood cells. (B) Clustering of samples based on genes with high precision in the dataset. (C) Overlap of present genes in human blood cells. (D) Patterns of enrichment (red) or depletion (blue) for different biologic processes of the PANTHER classification for the genes differentially expressed in different blood cell types. The color range represents Z-scores (from Z = 3 to Z = 10 for enrichment and Z = − 3 to Z = − 10 for depletion). Functional categories containing at least 20 genes were used in this analysis.
Figure 3
Figure 3
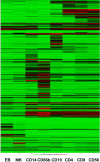
Clustering of samples on the basis of CD marker expression recapitulates cell ontogeny. Samples were clustered using the mean normalized intensity values for the 356 probes that map to CD markers.
Figure 4
Figure 4
Transcription factor coexpression in hematopoietic lineages. Shown at the top is the hematopoietic differentiation hierarchy with key hematopoietic transcription factors GATA1, GATA2, Meis1, SPI1, GATA3, and EBF1. Only MEIS1 and EBF1 were expressed in a single lineage, whereas all other factors were expressed in 2 or more lineages. Tabulated underneath each factor are those transcription factors that share their respective expression pattern, suggesting either direct regulation or common upstream regulators. Expression of GATA1 in CD66b+ cells was an order of magnitude lower than in erythroblasts and megakaryocytes.
Figure 5
Figure 5
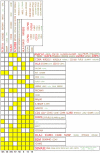
The IgSF protein expression profiles in the HaemAtlas. The expression patterns of cell-specific IgSF family members (columns) together with those expressed across several cell types (rows) are depicted, with yellow boxes indicating cells in which genes are expressed. For example, CD8+ T cells are the only cell type to express CD8B, whereas FcRLB and LAIR1 are expressed in NK and B cells. The size of the font and the green-to-red color intensity are both indicative of the strength of mean expression across the cells.
Figure 6
Figure 6
Evolutionary conservation of human versus mouse gene expression in various hematopoietic cell types. (A) Schematic representation of overlap in differential gene expression between human and mouse. The percentage of maximum possible overlap, shown in parentheses, is the percentage of orthologous proteins of the lower number (human or mouse) of DE genes. For the 7 cell types with data in both human and mouse, the extent of conservation of differential gene expression is shown at the level of (B) all transcripts and (C) transcription factors only. For those genes that were detected as expressed in human blood cells, mouse orthologs were identified as described. The presence of these orthologs in the mouse data was then investigated. Venn diagrams showing the number of overlapping genes with the number of orthologs identified shown in parentheses.
Figure 7
Figure 7
Identification of differentially expressed genes in MKs. For each cell type, we identified transcripts that were up- or down-regulated versus all other cell types as described. The outcome for MKs is shown.
Figure 8
Figure 8
CD248 expression is restricted to CD8+CD45RA+ T cells. Flow cytometry with 4 different CD248 antibodies on lymphocytes from (A) peripheral blood and (B) tonsil. Lymphocytes were first gated on forward scatter and side scatter and then on the specific markers shown (CD3, CD4, CD8, CD45RO, CD45RA). All 4 CD248-specific monoclonal antibodies (B1 35.1, B1 473, 18 37.30, and B1 22.4) show that CD248 expression is restricted to CD8+CD45RA+ T cells. Nonfilled histograms represent anti-CD248; and gray-filled histograms, negative control.

Comment in

References

    1. Zola H, Swart B, Nicholson I, et al. CD molecules 2005: human cell differentiation molecules. Blood. 2005;106:3123–3126. - PubMed
    1. Su AI, Cooke MP, Ching KA, et al. Large-scale analysis of the human and mouse transcriptomes. Proc Natl Acad Sci U S A. 2002;99:4465–4470. - PMC - PubMed
    1. Protty MB, Watkins NA, Colombo D, et al. Identification of Tspan9 as a novel platelet tetraspanin and the collagen receptor GPVI as a component of tetraspanin microdomains. Biochem J. 2009;417:391–400. - PMC - PubMed
    1. Soranzo N, Rendon A, Gieger C, et al. A novel variant on chromosome 7q22.3 associated with mean platelet volume, counts and function. Blood. 2009;113:3831–3837. - PMC - PubMed
    1. O'Connor MN, Salles II, Cvejic A, et al. Functional genomics in zebrafish permits rapid characterization of novel platelet membrane proteins. Blood. 2009;113:4754–4762. - PMC - PubMed

Publication types

Substances