. 2009 Feb 18;29(7):2027-42.
doi: 10.1523/JNEUROSCI.4531-08.2009.

Regulation of persistent Na current by interactions between beta subunits of voltage-gated Na channels

Affiliations

Regulation of persistent Na current by interactions between beta subunits of voltage-gated Na channels

Teresa K Aman et al. J Neurosci. .

Abstract

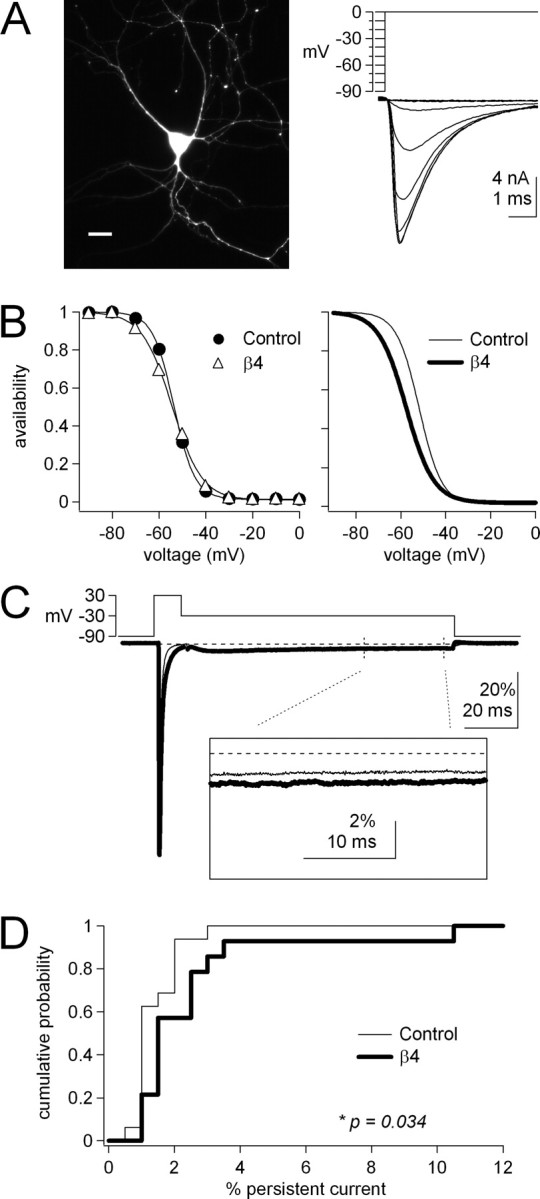
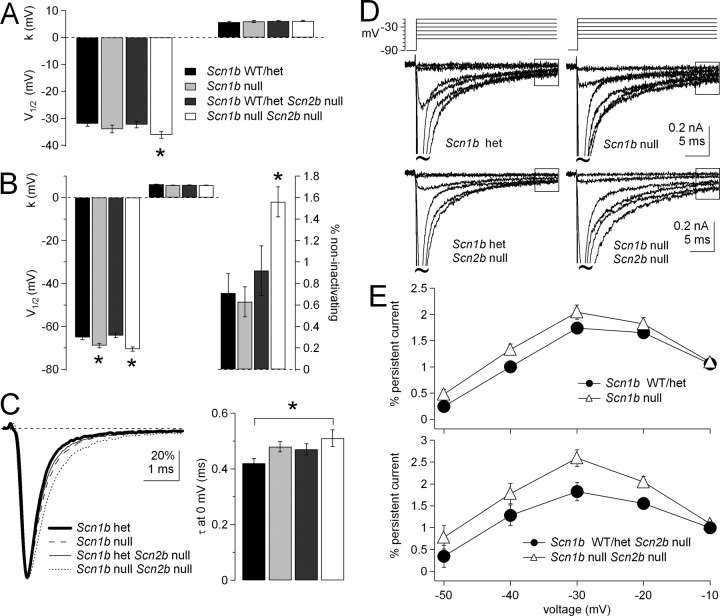
The beta subunits of voltage-gated Na channels (Scnxb) regulate the gating of pore-forming alpha subunits, as well as their trafficking and localization. In heterologous expression systems, beta1, beta2, and beta3 subunits influence inactivation and persistent current in different ways. To test how the beta4 protein regulates Na channel gating, we transfected beta4 into HEK (human embryonic kidney) cells stably expressing Na(V)1.1. Unlike a free peptide with a sequence from the beta4 cytoplasmic domain, the full-length beta4 protein did not block open channels. Instead, beta4 expression favored open states by shifting activation curves negative, decreasing the slope of the inactivation curve, and increasing the percentage of noninactivating current. Consequently, persistent current tripled in amplitude. Expression of beta1 or chimeric subunits including the beta1 extracellular domain, however, favored inactivation. Coexpressing Na(V)1.1 and beta4 with beta1 produced tiny persistent currents, indicating that beta1 overcomes the effects of beta4 in heterotrimeric channels. In contrast, beta1(C121W), which contains an extracellular epilepsy-associated mutation, did not counteract the destabilization of inactivation by beta4 and also required unusually large depolarizations for channel opening. In cultured hippocampal neurons transfected with beta4, persistent current was slightly but significantly increased. Moreover, in beta4-expressing neurons from Scn1b and Scn1b/Scn2b null mice, entry into inactivated states was slowed. These data suggest that beta1 and beta4 have antagonistic roles, the former favoring inactivation, and the latter favoring activation. Because increased Na channel availability may facilitate action potential firing, these results suggest a mechanism for seizure susceptibility of both mice and humans with disrupted beta1 subunits.


Figures

Figure 1.
Figure 1.
Expression of β4 negatively shifts activation and increases the noninactivating component of Na currents in HEK–NaV1.1 cells. A, Top left, Representative TTX-sensitive Na currents (bottom) evoked by the activation voltage protocol (top). Top right, Single representative activation curves, plotted as normalized conductance against voltage for a control cell (circles) and a cell transfected with β4 (triangles). Parameters are as follows: control: V1/2 = −15.6 mV, k = 5.7 mV; β4: V1/2 = −20.6 mV, k = 5.7 mV. Bottom left, Mean parameters of fits to data from control (n = 15) and β4-transfected (n = 13) cells. Left bars, V1/2; middle bars, k; right bars, Gmax. Asterisks in all figures indicate statistical differences from control, unless indicated otherwise. Transfection with β4 significantly hyperpolarized the V1/2 of activation. Bottom right, Boltzmann functions with mean fit parameters. B, Top left, Representative TTX-sensitive Na currents (bottom) evoked by the inactivation voltage protocol (top). Top right, Single representative inactivation curves, plotted as normalized current (availability) at 0 mV against conditioning potential, for a control cell (circles) and a cell transfected with β4(triangles). Parameters are as follows: control: V1/2 = −43.6 mV, k = 6.4 mV; percentage noninactivating is 1.1%; β4: V1/2 = −44.4 mV, k = 7.4 mV; percentage noninactivating is 7.2%. Bottom left, Mean parameters of fits to data from control (n = 15) and β4-transfected (n = 13) cells. Left bars, V1/2; middle bars, k; right bars, percentage of noninactivating current. β4 transfection increased the steady-state component of the inactivation curve. Bottom right, Boltzmann functions with mean fit parameters. C, Top, Voltage protocol and representative traces evoked in the absence and presence of β4 subunit expression. The box indicates the region of the trace in which persistent current was measured. Bottom, Persistent current measured as the mean current in the last 10 ms of each 100 ms step, normalized to the peak transient current at 0 mV and plotted versus voltage. β4-transfected cells (n = 13) had significantly more persistent current than control cells (n = 15). Error bars indicate SEM.
Figure 2.
Figure 2.
Expression of the β4 subunit increases persistent, but not resurgent, Na current. A, Voltage protocol and representative traces for each condition, as labeled. Traces were normalized to the peak current evoked at 0 mV in each cell. B, Top, Mean peak currents evoked during repolarization after subtraction of the steady-state current at the end of each trace. Currents were normalized to the peak transient current evoked in each cell at 0 mV and plotted versus voltage. Control, n = 15; β4 peptide, n = 10; β4 protein, n = 13. Bottom, Mean persistent currents, measured as the mean steady-state current in the last 10 ms of the repolarizing step. Currents were normalized and plotted as in the top panel. Same cells as in the top panel. C, Top, Voltage protocol (top) and representative control traces (middle) for assaying recovery from inactivation after conditioning at +60 mV. The first step to 0 mV in the voltage protocol is the reference step. Bottom, The conditioning current and first test current at higher gain. Mean peak currents evoked by test steps after a conditioning step to +60 mV, normalized to the peak current evoked by the reference step and plotted versus recovery interval, are shown. Recovery was faster in β4 peptide cells (n = 4) compared with either control (n = 5) or β4 protein (n = 5) cells. Error bars indicate SEM.
Figure 3.
Figure 3.
Coexpression of wild-type β1 subunit, but not the GEFS+ mutant subunit β1C121W, prevents the β4-mediated destabilization of inactivation. A, Voltage protocol to elicit persistent current and representative traces evoked with β subunit transfection as labeled. The box indicates the region of the trace analyzed in B. B, Persistent currents measured as in Figure 1C, plotted versus voltage. Mean persistent currents for control (dashed line) and β4-transfected (dotted line) are replotted for comparison. Left, β1-transfected (n = 9) cells have small persistent currents, similar to control cells. Right, The increase in persistent current by β4 was prevented by coexpression of β1 (n = 14). Coexpression of β1C121W with β4 (n = 16) prevented the increase in persistent current nearly as well as wild-type β1. C, Top, Representative Na currents evoked by a 5 ms step to 0 mV for five conditions, as labeled. Bottom, Mean time constants from single exponential fits to currents evoked as in A (left bars) and the percentage of current remaining at the end of the 5 ms step (right bars) are shown for each condition for control cells (n = 26) and for cells transfected with β1 (n = 9), β4 (n = 20), β1+β4 (n = 14), and β4+β1C121W (n = 17). Asterisks indicate significant differences from control. Error bars indicate SEM.
Figure 4.
Figure 4.
Association of Nav1.1, β1, β1C121W, and β4 subunits. Coimmunoprecipitation experiments of Na+ channel α and β subunits were performed on transfected HEK-293T cells. All molecular weight standards are indicated in kilodaltons. A, Nav1.1 associates with β1 and with β1C121W. Cells expressing Nav1.1+β1-V5 or Nav1.1+β1C121W -V5 were immunoprecipitated with anti-pan Na+ channel antibody or rabbit IgG. The immunoblot was probed with anti-V5 antibody to detect β1-V5 or β1C121W -V5. Immunoreactive β1 bands are indicated by the arrow. B, Nav1.1 and β1 or β1C121W associate in the presence of β4. Cells expressing Nav1.1+β1-V5+β4 or Nav1.1+β1C121W-V5+β4 were immunoprecipitated with anti-pan Na+ channel antibody or rabbit IgG. The immunoblot was probed with anti-V5 antibody to detect β1-V5 or β1C121W-V5. Immunoreactive β1 bands are indicated by the arrow. C, β1 or β1C121W associates with β4 in the absence of α subunits. Cells expressing β1-V5+β4 or β1C121W-V5+β4 were immunoprecipitated with anti-V5 antibody or mouse IgG. The immunoblot was probed with anti-β4 antibody. Immunoreactive β4 bands are indicated by the arrow. D, Association of Nav1.1 and β4. Cells expressing Nav1.1+β4 were immunoprecipitated with anti-pan Na+ channel antibody or rabbit IgG. The immunoblot was probed with anti-β4 antibody. Immunoreactive β4 bands are indicated by the arrow. A lane containing rat brain membranes, prepared as by Brackenbury et al. (2008), is included as a positive control to show β4 immunoreactivity. IP, Immunoprecipitation; IB, immunoblot.
Figure 5.
Figure 5.
Chimeric β subunits suggest that the extracellular domain regulates persistent current amplitude. A, Persistent currents measured as in Figure 1C, plotted versus voltage. Mean persistent currents for control (dashed line) and β4 transfected (dotted line) are replotted for comparison. The percentage of persistent current is plotted versus voltage for NaV1.1 with expression of the following subunits: top left, either β1 (n = 9) or the β1/4 chimera (n = 7); top right, either β2 (n = 12) or the β2/4 chimera (n = 9); bottom left, β1+β4 (n = 14) or β1/4+β4 (n = 11). B, Time constants from single exponential fits to the decay of transient current at 0 mV (top) and the percentage of current remaining at the end of the 5 ms step (bottom) as in Figure 3C for cells transfected with β1/4 (n = 7), β2 (n = 12), β2/4 (n = 9), and β1/4+β4 (n = 11). Relevant data for control, β1, β4, and β1+β4 are included for comparison. Asterisks indicate significant differences from control. Error bars indicate SEM.
Figure 6.
Figure 6.
Changes in activation and inactivation parameters increase the window current in HEK–NaV1.1-expressing β4 and β2 but not β1. A, Inactivation parameters were estimated as in Figure 1B, and the noninactivating component is shown for all conditions, as labeled. The n values are as in Figures 3 and 4. B, V1/2 of inactivation for all conditions; it was not correlated with the percentage of noninactivating current (R2 = 0.06). C, The noninactivating component versus the inactivation slope factor, for all conditions, as labeled. The dashed line is the linear fit to the data, with R2 = 0.79. D, Activation parameters were estimated as in Figure 1A, and the activation k is shown for all conditions, as labeled. The n values are as follows: control (α), 15; β4, 13; β2/4, 9; β2, 11; β1/4, 5; β1+β4, 13; β1, 9, β1CW+β4, 13; β1/4+β4, 11. Activation k did not correlate with the percentage of noninactivating current (R2 = 0.11). E, The noninactivating component of the availability curve versus the activation V1/2. The dashed line is the linear fit to the data, with the point corresponding to β1C121W+β4 (open symbol) excluded. R2 = 0.67. F, Conductance and availability curves with the mean activation and inactivation parameters for β1 (thin line) and β4 (thick line) in HEK–NaV1.1 cells, illustrating the larger window and noninactivating current with β4 relative to β1. G, Conductance and availability curves as in F for β1+β4 and β1CW+β4. The inset illustrates the difference in the time course of inactivation between β1+β4 and β1C121W+β4 (same traces as in Fig. 3C). Error bars indicate SEM.
Figure 7.
Figure 7.
Overexpression of β4 produces a small but consistent increase in persistent current in cultured CA3 hippocampal neurons. A, Left, Cultured CA3 neuron transfected with GFP. Scale bar, 25 μm. Right, Voltage protocol to generate steady-state availability curves and representative Na currents elicited in a β4-transfected neuron. B, Left, Single availability curves from a control and a β4-transfected neuron. Parameters of fits for control and β4 are as follows: V1/2, −53.7, −54.5; k, 4.5, 6.4; percentage noninactivating, 1.3, 0.9. Right, Boltzmann curves with the mean parameters for control and β4-transfected cells. C, Voltage protocol to evoke resurgent and persistent current and representative responses from a control neuron (thin trace) and a β4-transfected neuron (thick trace). Currents are normalized to the peak transient current evoked in each cell at 0 mV. The inset shows the persistent current at a higher gain. D, Cumulative probability plot of the persistent current amplitude in control (n = 14) and β4-transfected (n = 16) cells. The y value indicates the probability of finding a cell in which the persistent current is less than or equal to the x value. The distribution was significantly shifted to larger persistent currents in β4-transfected cells.
Figure 8.
Figure 8.
Early persistent currents are increased in Scn1b null and Scn1b Scn2b double-null Purkinje neurons. A, Activation parameters were obtained and plotted as in Figure 1A for Purkinje neurons from Scn1b and Scn2b wild-type, heterozygous, or null mice, as labeled. The n values are as follows: Scn1b wild type and heterozygous, 8; Scn1b nulls, 6; Scn2b nulls, 9; double nulls, 19. Asterisks indicate significant differences relative to littermate controls. B, Inactivation parameters were obtained and plotted as in Figure 1B. C, Left, Representative transient currents evoked by a voltage step to 0 mV for the four conditions. Right, Mean time constants from single exponential fits to current decays at 0 mV. D, Voltage protocols and representative Na currents from Purkinje cells isolated from a Scn1b heterozygous, Scn1b null, Scn1b heterozygous Scn2b null, and Scn1b Scn2b double-null mouse, as labeled. E, The mean early persistent current from the last 5 ms of a 30 ms step (boxed area in D), normalized to the peak transient current at 0 mV and plotted versus voltage. Top, Loss of β1 (n = 11) compared with littermate controls (n = 11). Bottom, Loss of β1 expression on an Scn2b null background (n = 30) compared with littermate controls (n = 11). WT, Wild type; het, heterozygous. Error bars indicate SEM.

Similar articles

Cited by

References

    1. Abriel H, Kass RS. Regulation of the voltage-gated cardiac sodium channel Nav1.5 by interacting proteins. Trends Cardiovasc Med. 2005;15:35–40. - PubMed
    1. Afshari FS, Ptak K, Khaliq ZM, Grieco TM, Slater NT, McCrimmon DR, Raman IM. Resurgent Na currents in four classes of neurons in the cerebellum. J Neurophysiol. 2004;92:2831–2843. - PubMed
    1. Ahn M, Beacham D, Westenbroek RE, Scheuer T, Catterall WA. Regulation of Nav1.2 channels by brain-derived neurotrophic factor, TrkB, and associated Fyn kinase. J Neurosci. 2007;27:11533–11542. - PMC - PubMed
    1. Alzheimer C, Schwindt PC, Crill WE. Modal gating of Na+ channels as a mechanism of persistent Na+ current in pyramidal neurons from rat and cat sensorimotor cortex. J Neurosci. 1993;13:660–673. - PMC - PubMed
    1. Annesi G, Gambardella A, Carrideo S, Incorpora G, Labate A, Pasqua AA, Civitelli D, Polizzi A, Annesi F, Spadafora P, Tarantino P, Cirò Candiano IC, Romeo N, De Marco EV, Ventura P, LePiane E, Zappia M, Aguglia U, Pavone L, Quattrone A. Two novel SCN1A missense mutations in generalized epilepsy with febrile seizures plus. Epilepsia. 2003;44:1257–1258. - PubMed

Publication types

MeSH terms

LinkOut - more resources