. 2009 Feb 18;29(7):2064-75.
doi: 10.1523/JNEUROSCI.4755-08.2009.

Interdependent encoding of pitch, timbre, and spatial location in auditory cortex

Affiliations

Interdependent encoding of pitch, timbre, and spatial location in auditory cortex

Jennifer K Bizley et al. J Neurosci. .

Abstract

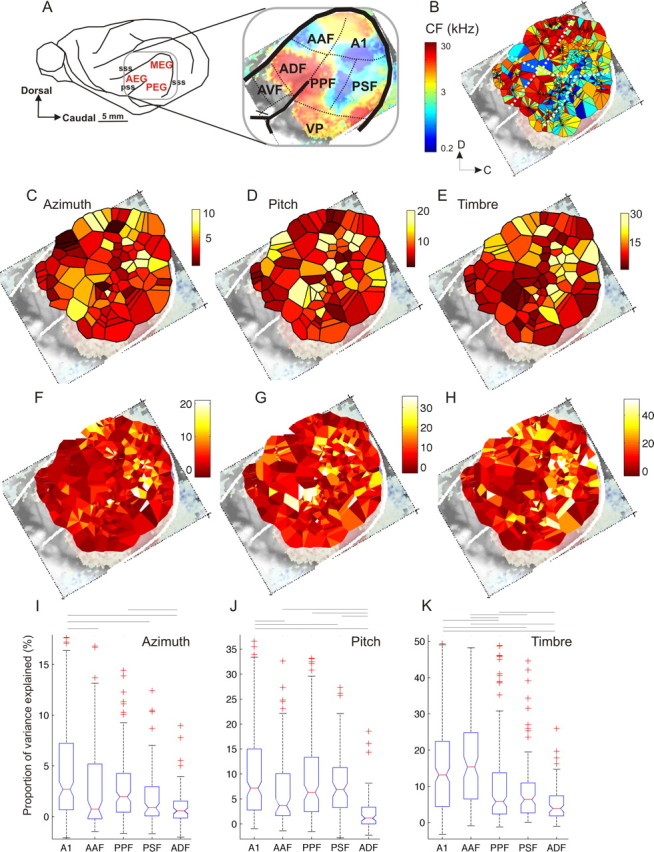
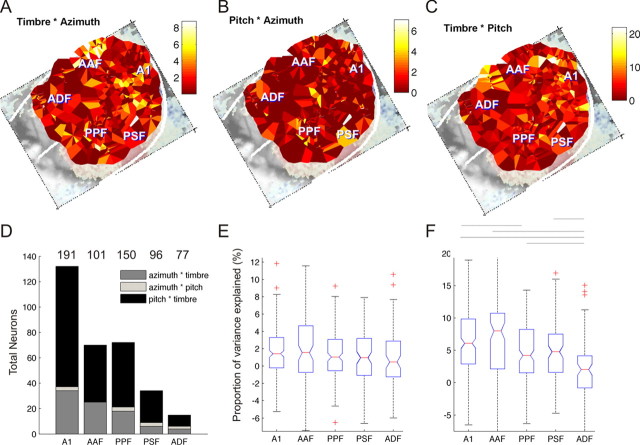
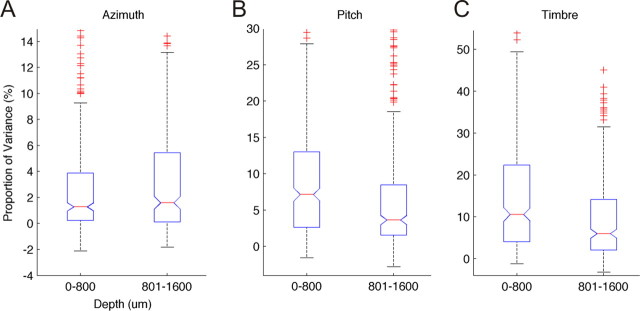
Because we can perceive the pitch, timbre, and spatial location of a sound source independently, it seems natural to suppose that cortical processing of sounds might separate out spatial from nonspatial attributes. Indeed, recent studies support the existence of anatomically segregated "what" and "where" cortical processing streams. However, few attempts have been made to measure the responses of individual neurons in different cortical fields to sounds that vary simultaneously across spatial and nonspatial dimensions. We recorded responses to artificial vowels presented in virtual acoustic space to investigate the representations of pitch, timbre, and sound source azimuth in both core and belt areas of ferret auditory cortex. A variance decomposition technique was used to quantify the way in which altering each parameter changed neural responses. Most units were sensitive to two or more of these stimulus attributes. Although indicating that neural encoding of pitch, location, and timbre cues is distributed across auditory cortex, significant differences in average neuronal sensitivity were observed across cortical areas and depths, which could form the basis for the segregation of spatial and nonspatial cues at higher cortical levels. Some units exhibited significant nonlinear interactions between particular combinations of pitch, timbre, and azimuth. These interactions were most pronounced for pitch and timbre and were less commonly observed between spatial and nonspatial attributes. Such nonlinearities were most prevalent in primary auditory cortex, although they tended to be small compared with stimulus main effects.


Figures

Figure 1.
Figure 1.
Stimuli and example responses. A, Frequency spectra for 16 of the artificial vowel stimuli used in this experiment. The four timbres used (corresponding to the vowels /a/, /ε/, /u/, and /i/) are shown in different columns, with the four pitches (F0 of 200, 336, 565, and 951 Hz) shown in different rows. Each of these stimuli was also presented at one of four different virtual sound directions (−45°, −15°, 15°, and 45° azimuth). B, C, Spike raster plots from two different cortical neurons in response to all 64 stimulus combinations. In each case, the same data are replotted three times, organized either according to stimulus azimuth (Az), pitch (F0), or timbre (vowel, vID). Both of these units produced responses that were clearly dependent on at least two of the three stimulus dimensions.
Figure 2.
Figure 2.
Main effects and interactions of pitch, timbre, and azimuth. A–D, PSTH matrices illustrating the main effects and 2-way interactions of timbre, pitch, and azimuth on the responses of two cortical neurons. Data are sorted according to two of the three stimulus dimensions, as indicated on the left and top margins of each panel, and averaged across the third. Each PSTH shows the mean firing rate post stimulus onset in Hz. The effects of stimulus pitch and timbre (vowel identity) are plotted in A and B and the effects of stimulus azimuth and pitch are shown in C and D. A, C, Data from the neuron whose responses are shown in Figure 1 B. B, D, Data from the neuron shown in Figure 1 C. The first four rows and columns of each PSTH matrix represent the responses to combinations of the two stimulus parameters indicated. The cells at the end of each row and column show the average response to the stimulus parameter indicated by the corresponding row and column headers. For example, the cell at the end of the first row in A and B shows the mean response to a pitch of 200 Hz, regardless of timbre or location. The bottom right-hand PSTH in each matrix shows the overall grand average PSTH, constructed across all 64 stimulus conditions. The color scale underlay in each PSTH highlights the difference between it and the grand average PSTH, with blue indicating a decrease in firing relative to the average and red showing an increase. The color scales for the first four rows and columns in each of the four panels saturate at ±33 spikes/s in A, ±32 in B, ±11 in C, and ±8 in D. The color scales in the panels in the last row and bottom column saturate at ±60 spikes/s in A and C, and ±32 in B and D.
Figure 3.
Figure 3.
Distribution of relative sensitivity to location, pitch, and timbre across the auditory cortex. A, Location of ferret auditory cortex on the middle, anterior, and posterior ectosylvian gyri (MEG, AEG, and PEG, respectively). The inset shows the location of seven auditory cortical fields. The color scale shows the tonotopic organization as visualized using optical imaging of intrinsic signals (from Nelken et al., 2004). B, Voronoi tessellation map showing the characteristic frequencies (CFs) of all unit recordings made (n = 811). These data were collected from a total of five animals and have been compiled onto one auditory cortex map. Each tile of the tessellation shows the CF obtained from each recording site, using the same color scale as in A. C–E, Voronoi tessellation maps plotting the proportion of variance explained by each of the stimulus dimensions: azimuth (C), pitch (D), and timbre (E). Each tile represents the average value obtained at that penetration. All units included in the variance decomposition are shown (n = 619). F–H, as C–E, but here each individual unit is plotted, with tiles representing units from a single penetration arranged counterclockwise by depth around the penetration site. I–K, Box-plots showing the proportion of variance explained by azimuth (I), pitch (J), and timbre (K) for each of the five cortical areas examined. The boxes show the upper and lower quartile values, and the horizontal lines at their “waist” indicate the median. In all cases, there was a significant effect of cortical field on the distribution of variance values (Kruskal–Wallis test, p < 0.001), and significant pairwise differences are indicated by the horizontal lines above the plots (Tukey–Kramer post hoc test, p < 0.05).
Figure 4.
Figure 4.
Nonlinear sensitivity to stimulus combinations. A–C, Maps showing the distributions of neural sensitivity attributable to (proportion of response variance explained by) timbre × azimuth (A), pitch × azimuth (B), or timbre × pitch (C) nonlinear two-way interactions. D, Histogram showing the number of units in each field in which there were significant two-stimulus interactions for each of these stimulus parameter combinations. The total number of units recorded in each cortical field are listed above. E, F, Box-plots summarizing the statistical distributions of the summed azimuth × timbre and azimuth × pitch interactions (E), and the pitch × timbre interactions (F). There was no significant difference in the distribution between fields for the interactions between spatial and nonspatial parameters shown in E (p = 0.24). In contrast, the magnitude of the pitch × timbre interactions did vary with cortical field (p < 0.001). Horizontal lines above the box-plots show which distributions had pairwise significantly different means (Tukey–Kramer post hoc test, p < 0.05).
Figure 5.
Figure 5.
Parameter sensitivity in superficial and deep cortical layers. A–C, Distribution of parameter sensitivity (response variance attributable) to azimuth (A), pitch (B), and timbre (C) for responses recorded at superficial (<800 μm) or deep (>800 μm) cortical locations. Higher sensitivities to pitch and timbre were relatively more common in the superficial layers.

References

    1. Ahveninen J, Jääskeläinen IP, Raij T, Bonmassar G, Devore S, Hämäläinen M, Levänen S, Lin FH, Sams M, Shinn-Cunningham BG, Witzel T, Belliveau JW. Task-modulated “what” and “where” pathways in human auditory cortex. Proc Natl Acad Sci U S A. 2006;103:14608–14613. - PMC - PubMed
    1. Alain C, Arnott SR, Hevenor S, Graham S, Grady CL. “What” and “where” in the human auditory system. Proc Natl Acad Sci U S A. 2001;98:12301–12306. - PMC - PubMed
    1. Barrett DJ, Hall DA. Response preferences for “what” and “where” in human non-primary auditory cortex. Neuroimage. 2006;32:968–977. - PubMed
    1. Bendor D, Wang X. The neuronal representation of pitch in primate auditory cortex. Nature. 2005;436:1161–1165. - PMC - PubMed
    1. Bizley JK, King AJ. Visual-auditory spatial processing in auditory cortical neurons. Brain Res. 2008;1242:24–36. - PMC - PubMed

Publication types

MeSH terms

LinkOut - more resources