. 2009 Feb 18;29(7):2103-12.
doi: 10.1523/JNEUROSCI.0980-08.2009.

Development of spontaneous recurrent seizures after kainate-induced status epilepticus

Affiliations

Development of spontaneous recurrent seizures after kainate-induced status epilepticus

Philip A Williams et al. J Neurosci. .

Abstract

Acquired epilepsy (i.e., after an insult to the brain) is often considered to be a progressive disorder, and the nature of this hypothetical progression remains controversial. Antiepileptic drug treatment necessarily confounds analyses of progressive changes in human patients with acquired epilepsy. Here, we describe experiments testing the hypothesis that development of acquired epilepsy begins as a continuous process of increased seizure frequency (i.e., proportional to probability of a spontaneous seizure) that ultimately plateaus. Using nearly continuous surface cortical and bilateral hippocampal recordings with radiotelemetry and semiautomated seizure detection, the frequency of electrographically recorded seizures (both convulsive and nonconvulsive) was analyzed quantitatively for approximately 100 d after kainate-induced status epilepticus in adult rats. The frequency of spontaneous recurrent seizures was not a step function of time (as implied by the "latent period"); rather, seizure frequency increased as a sigmoid function of time. The distribution of interseizure intervals was nonrandom, suggesting that seizure clusters (i.e., short interseizure intervals) obscured the early stages of progression, and may have contributed to the increase in seizure frequency. These data suggest that (1) the latent period is the first of many long interseizure intervals and a poor measure of the time frame of epileptogenesis, (2) epileptogenesis is a continuous process that extends much beyond the first spontaneous recurrent seizure, (3) uneven seizure clustering contributes to the variability in occurrence of epileptic seizures, and (4) the window for antiepileptogenic therapies aimed at suppressing acquired epilepsy probably extends well past the first clinical seizure.


Figures

Figure 1.
Figure 1.
Graphical description of the step function (A) and continuous-function (B) hypotheses of the time course of epileptogenesis. The step function hypothesis describes two states: the first state is a seizure-free period that occurs after the initial brain insult (i.e., the latent period; not epileptic), and the second state is a period with seizures (i.e., epileptic). An important functional implication of the step function hypothesis is that the underlying causes of or mechanisms responsible for the generation of seizures are mature when the first seizure is observed, and the seizure rate immediately achieves a steady state or is variable. The continuous-function hypothesis states that seizure probability increases continuously after a brain insult; when considered as a sigmoid function of time after injury, the hypothesis predicts a gradual increase in seizure frequency or probability, followed by a period with an exponential increase, and then the gradual development of a steady state. In the continuous-function hypothesis, those factors that influence the generation of seizures and that control seizure rate are not fully developed at the time of the appearance of the first or “sentinel” seizure, and thus the seizure rate continuously increases with time as those processes mature.
Figure 2.
Figure 2.
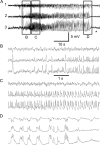
An electrographic seizure from a kainate-treated rat recorded with radiotelemetry. A, These traces show an entire nonconvulsive seizure, which lasted ∼45 s. Trace 1 corresponds to the surface recording at the level of the dura, trace 2 was from the left hippocampus, and trace 3 from the right hippocampus. B, Seizure initiation with a single large EEG “spike” on all leads (i.e., based on the duration, this event and other “spikes” were presumably synchronous excitatory postsynaptic potentials, and not synchronous action potentials or “population spikes”), followed by high-amplitude high-frequency (i.e., ≥5 Hz) EEG spike activity that signaled the beginning of the seizure. Note that the horizontal scale bar corresponds to a faster timescale. C, Progression of the pattern from individual events into regular, high-frequency, large-amplitude EEG spikes (i.e., the tonic phase of the seizure). D, Activity near the termination of the seizure, with large-amplitude waves containing multiple EEG spikes (i.e., clonic phase), followed by a relative silent period (A, asterisk).
Figure 3.
Figure 3.
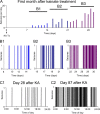
Raster plots of electrographic seizure frequency from an individual animal for the first month (A) and for different 1 week (B1–B3) or 1 d (C1, C2) periods. The data show the typical increase in seizure frequency and the occurrence of seizure clusters throughout the 100 d recording period in an individual animal. A, Daily seizure frequency for the first 30 d. B1–B3, Raster plots to illustrate the occurrence of seizures and the interseizure intervals for the second (B1), third (B2), and fourth (B3) weeks [no seizures were seen during the first week (i.e., the latent period for electrographic seizures)]. C1, C2, A 24 h period at day 28 (C1) and day 87 (C2) after kainate treatment. These data from a single animal illustrate the time-dependent increase in seizure frequency and the occurrence of seizure clusters (i.e., short interseizure intervals). The clusters began to occur relatively soon after the onset of spontaneous recurrent seizures, and continued throughout the 100 d recording period.
Figure 4.
Figure 4.
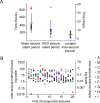
Similarity of the latent periods and the longest early interseizure intervals after kainate-induced status epilepticus. A, A plot of the latent periods for convulsive motor seizures (motor seizures with video-EEG documentation), nonconvulsive electrographically recorded seizures (i.e., EEG seizures without a convulsion), and the longest subsequent interseizure interval of the first 20 electrographically recorded intervals for each of the nine animals. The horizontal bars indicate the mean values, and the vertical bars show the SDs. These data show that the longest interseizure interval (see B, below) after the first motor seizure was comparable with the latent period for electrographic seizures, which provides one line of evidence for the hypothesis that the onset of epileptogenesis is a continuous function of time. B, The interseizure intervals for the first 20 electrographically recorded seizures for individual rats. This figure demonstrates the high variability in interseizure intervals in the early period of seizure progression, in which several of the long interseizure intervals were comparable with the latent period for the first electrographic seizure, and the short interseizure intervals represent seizure clusters. Each symbol and color represents an individual animal for A and B (see right side of panel).
Figure 5.
Figure 5.
Seizure frequency as a function of time after kainate-induced status epilepticus. A, The mean frequency of the electrographically recorded seizures for the group of nine kainate-treated rats increased as a function of time after status epilepticus. A sigmoid curve best described the overall time-dependent increase in seizure rate. The dashed red line shows the time to reach the half-maximum point on the sigmoid curve. Based on the sigmoid curve, the increase in seizure frequency could be divided into four stages. Stage 1 was the latent period for electrographic seizures (note: the MSL arrow denotes the mean latent period for convulsive motor seizures), and stage 2 was the period of a slow, progressive increase in seizure rate (i.e., the slow growth phase), which was followed by the exponential growth phase in seizure rate (stage 3). The plateau phase (stage 4) was the final steady-state seizure rate found in some animals. Although the plateau phase was not seen in all rats (see B and C below) (supplemental Fig. 2, available at www.jneurosci.org as supplemental material), this was likely attributable to the limited duration of the monitoring (i.e., 100 d). In the repeated, low-dose kainate model, previous data suggest that most rats generally do not reach a steady state in seizure frequency for several months (Hellier et al., 1998), but some animals ultimately have such a high seizure frequency that they are often in status epilepticus. B, C, Plot of the data of actual seizure frequency (B) and normalized seizure frequency (C) from the nine individual animals (A–I) that comprised the group data shown in A [the mean and SE of seizure frequency of each animal is shown in supplemental Fig. 2 (available at www.jneurosci.org as supplemental material)]. The data shown in Figure 3 were recorded from rat D.
Figure 6.
Figure 6.
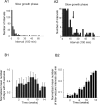
Seizure clusters. A, Frequency histograms of the interseizure intervals for the group of nine kainate-treated rats during the slow growth phase (A2 is a vertical expansion of A1) show two peaks. The first bin (<250 min; or ∼4 h) had the largest number of the interseizure intervals, and the number of interseizure intervals per bin was progressively smaller for longer time periods during the slow growth phase (A1). Many of these short intervals were “within-cluster” seizures. A second peak in the frequency histogram (A2, arrow) is evident and shows the long interseizure intervals associated with the low mean seizure frequency. Many of these longer interseizure intervals represent “intercluster” intervals. B, Mean number of potential clusters (normalized for seizure frequency) as a function of time after kainate-induced status epilepticus. In B1, the number of days per week with three or more seizures per day was analyzed; the number of times two seizures occurred within 1 h of each other was analyzed in B2. B1, Although the mean number of days per week in which three or more seizures was observed [i.e., a definition of seizure clusters used in human clinical studies (Haut et al., 1999)] increased as a function of time after kainate-induced status epilepticus, no progressive increase in seizures was seen when the data were normalized to the weekly seizure frequency, which indicates that this definition of seizure clustering was problematic in the kainate model because of the high seizure frequency. B2, Mean number of seizures occurring within 1 h or less of each other per week. Mean number of interseizure intervals of ≤1 h (defined here as one measure of a seizure cluster), normalized to the daily seizure rate [i.e., the number of interseizure intervals of ≤1 h (i.e., seizure clusters) per day was divided by the number of seizures per day], slowly increased until week 10.

Comment in

Similar articles

Cited by

References

    1. Annegers JF, Hauser WA, Coan SP, Rocca WA. A population-based study of seizures after traumatic brain injuries. N Engl J Med. 1998;338:20–24. - PubMed
    1. Ben-Ari Y. Limbic seizure and brain damage produced by kainic acid: mechanisms and relevance to human temporal lobe epilepsy. Neuroscience. 1985;14:375–403. - PubMed
    1. Bertram EH. Functional anatomy of spontaneous seizures in a rat model of limbic epilepsy. Epilpesia. 1997;38:95–105. - PubMed
    1. Bertram EH, Cornett JF. The ontogeny of seizures in a rat model of limbic epilepsy: evidence for a kindling process in the development of chronic spontaneous seizures. Brain Res. 1993;625:295–300. - PubMed
    1. Bertram EH, Cornett JF. The evolution of a rat model of chronic spontaneous limbic seizures. Brain Res. 1994;661:157–162. - PubMed

Publication types

MeSH terms