. 2009 Feb 18;29(7):2136-50.
doi: 10.1523/JNEUROSCI.3962-08.2009.

Correlates of perceptual learning in an oculomotor decision variable

Affiliations

Correlates of perceptual learning in an oculomotor decision variable

Patrick M Connolly et al. J Neurosci. .

Abstract

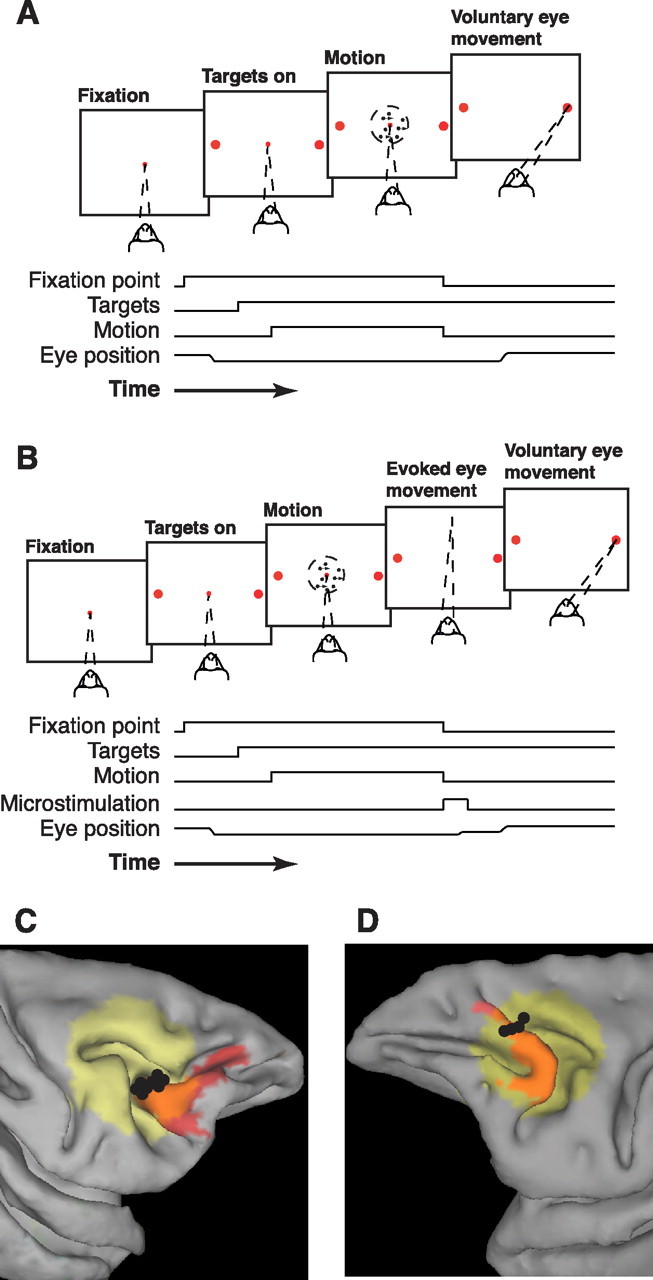
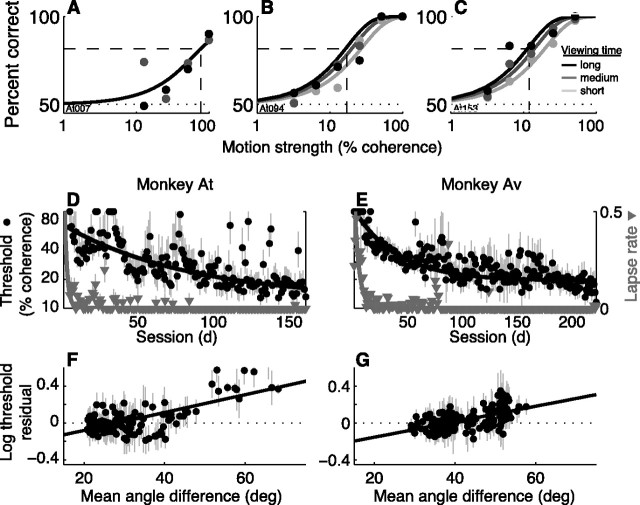
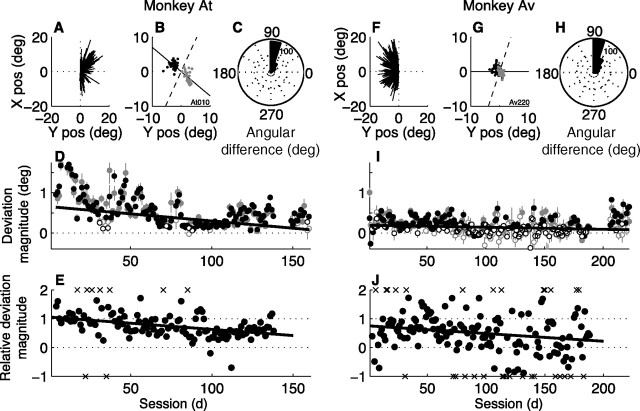
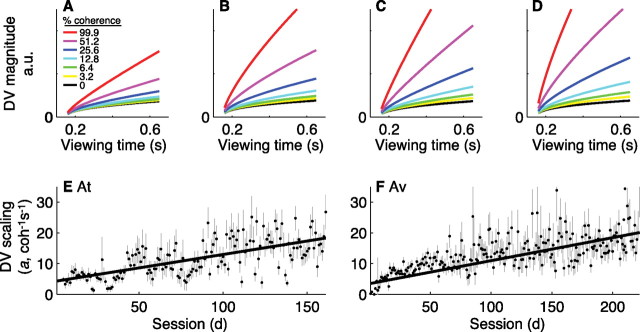
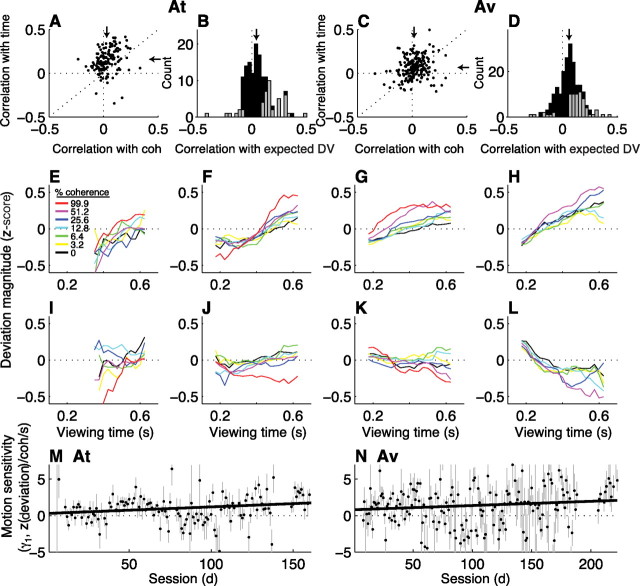
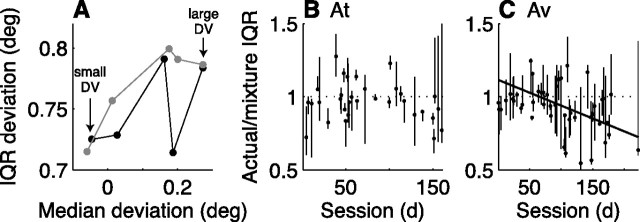
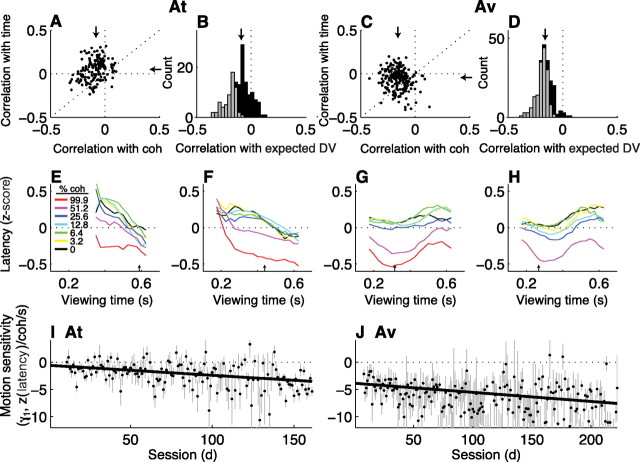
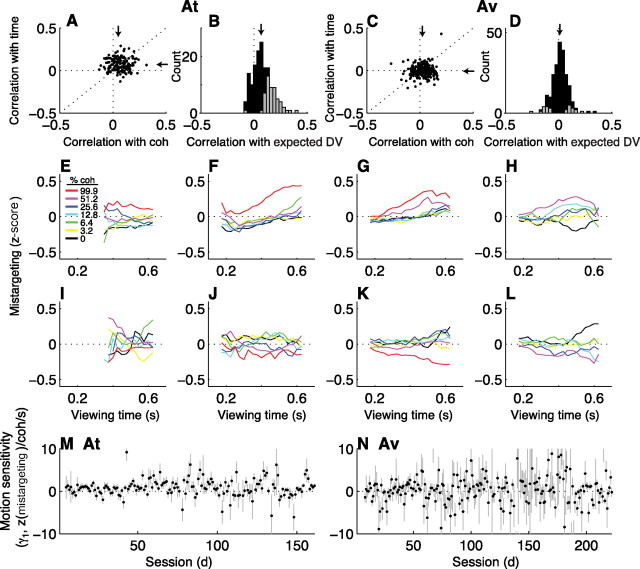
In subjects trained extensively to indicate a perceptual decision with an action, neural commands that generate the action can represent the process of forming the decision. However, it is unknown whether this representation requires overtraining or reflects a more general link between perceptual and motor processing. We examined how perceptual processing is represented in motor commands in naive monkeys being trained on a demanding perceptual task, as they first establish the sensory-motor association and then learn to form more accurate perceptual judgments. The task required the monkeys to decide the direction of random-dot motion and respond with an eye movement to one of two visual targets. Using electrically evoked saccades, we examined oculomotor commands that developed during motion viewing. Throughout training, these commands tended to reflect both the subsequent binary choice of saccade target and the weighing of graded motion evidence used to arrive at that choice. Moreover, these decision-related oculomotor signals, along with the time needed to initiate the voluntary saccadic response, changed steadily as training progressed, approximately matching concomitant improvements in behavioral sensitivity to the motion stimulus. Thus, motor circuits may have general access to perceptual processing used to select between actions, even without extensive training. The results also suggest a novel candidate mechanism for some forms of perceptual learning, in which the brain learns rapidly to treat a perceptual decision as a problem of action selection and then over time to use sensory input more effectively to guide the selection process.


Figures

Figure 1.
Figure 1.
Task design and microstimulation sites. A, Task without microstimulation. The monkeys viewed a random-dot stimulus with a randomly selected duration, motion strength, and direction (two alternatives separated by 180°) of motion. Simultaneous offset of the dots and fixation point indicated to the monkey to make a saccadic eye movement to one of two choice targets located along the axis of motion. A saccade to the target in the direction of motion was followed by auditory feedback and a juice reward. An incorrect saccade was followed by a brief time-out period. B, Task with microstimulation. After finding a microstimulation site in the FEF, the axis of motion was rotated to be approximately perpendicular to the evoked saccades. On a subset of trials, offset of the motion stimulus and fixation point was accompanied by onset of FEF microstimulation, causing an evoked saccade. The monkey then typically made a voluntary saccade to one of the two targets, followed by feedback. C, D, MRI reconstruction of microstimulation sites (black circles) in the FEF (red shaded region) from Felleman and Van Essen (1991) for At (C, right hemisphere) and Av (D, left hemisphere) using Caret (Van Essen et al., 2001) and AFNI (Cox, 1996) brain-mapping software. Yellow shaded region indicates the projection of the recording cylinder onto the surface of the brain (Kalwani et al., 2009).
Figure 2.
Figure 2.
Performance. A–C, Data (points) and decision model fits (solid lines; see Eqs. 1–4) from individual sessions for monkey At. Percentage of correct responses is plotted versus motion strength. Grayscale values correspond to different viewing times (three equally spaced bins between 100 and 800 ms, with darker symbols for longer times). More trials with lower coherences and shorter viewing times were added as training progressed and sensitivity improved to maintain an approximately constant overall percentage of correct responses per session. Dashed lines indicate threshold (percentage coherence corresponding to 82% correct at long viewing times, corrected for lapses as in Eq. 4). D, E, Lapse rate (errors for high-coherence, long-duration stimuli; gray triangles, right ordinate) and discrimination threshold (black symbols, left ordinate with a logarithmic scale) as a function of session for At (D) and Av (E). Error bars are SEM. Lines are weighted fits to a decaying single-exponential function. F, G, Degradation of perceptual sensitivity for unfamiliar axes of motion for At (F) and Av (G). The residuals to the exponential fits to threshold (in logarithmic units) in D and E, respectively, are plotted as a function of the familiarity of the axis of motion (the average, angular difference between the current axis of motion and the axes of motion from all previous sessions; larger values indicate less familiar axes). Only sessions with zero lapse rates were used. Lines are weighted linear fits. Positive slopes (H0: slope = 0, p < 0.01 in both panels) indicate that perceptual sensitivity tended to be worse than the current trend for less familiar axes of motion.
Figure 3.
Figure 3.
Relationship between evoked-saccade trajectories and the direction decision for monkey At (A–E) and Av (F–J). A, F, Average evoked-saccade vectors from individual sessions resulting from electrical microstimulation of the left (A) or right (F) FEF. B, G, Endpoints of evoked saccades from correct trials in a single session plotted relative to their running-mean values [to remove the effects of drift on the evoked-saccade trajectories and center the distributions of endpoints at zero, the location of the fixation point; see Materials and Methods and Gold and Shadlen (2000, 2003)] and separated by the subsequent voluntary choice (black points for leftward choices, gray for rightward choices). Solid line indicates the axis of motion. Dashed line indicates the optimal linear classifier for distinguishing between the two groups of points. C, H, Circular histogram of the distribution of the angle between the axis of motion and the optimal linear classifier separating evoked-saccade endpoints corresponding to the two direction choices for each session (the minimum angle between the solid and dashed lines in B and G). D, I, Magnitude of deviation versus session. Points and error bars are mean and SEM values, respectively, from correct (black symbols) or error (gray symbols) trials in individual sessions. Positive values indicate that evoked saccades tended to deviate in the direction of the monkey's subsequent choice. Filled symbols indicate H0: magnitude = 0, p < 0.01 (Mann–Whitney test). Lines are weighted linear fits to data from correct trials only (H0: slope = 0, p ≤ 0.05 in both panels). E, J, Ratio of the average magnitude of deviation measured on discrimination trials versus the average magnitude of deviation measured on instructed-saccade trials (which was not performed in all sessions). X marks indicate outliers that typically resulted from a near-zero denominator, plotted at outer bounds of −1 and 2. These points were not included in the linear fits (lines; H0: slope = 0, p < 0.01 in both cases). pos, Position; deg, degree.
Figure 4.
Figure 4.
The coherence- and time-dependent decision variable derived from behavior. A–D, Expected value of the decision variable [μ(C, T)/2v(C,T) from Eq. 3] from correct trials using the mean values of the best-fitting parameters fit to data from individual sessions for both monkeys (A: sessions 1–30; B: sessions 31–80 for At, 31–90 for Av; C: 81–142 for At, 91–170 for Av; D: 143–161 for At, 171–222 for Av) plotted as a function of viewing time for different motion strengths (see inset in A). E, F, Best-fitting value and SEM of the parameter a from Equation 2 describing the scaling of the decision variable fit to behavioral data from individual sessions for At (E) and Av (F), plotted as a function of session number. Lines are weighted linear fits (H0: slope = 0, p < 0.01 in both cases). a.u., Arbitrary units.
Figure 5.
Figure 5.
The coherence and time dependence of evoked-saccade deviations. A, C, Scatter plots of Spearman's rank correlation coefficients (ρ) between the trial-by-trial magnitude of deviation and the coherence (abscissa) or viewing time (ordinate) of the motion stimulus. Points indicate values of ρ computed from individual sessions for monkeys At (A) and Av (C) for correct trials. Arrows are medians. B, D, Histograms of ρ between the trial-by-trial magnitude of deviation and the coherence- and time-dependent decision variable inferred from behavior on correct trials computed for individual sessions for At (B) and Av (D). Arrows indicate median values. Gray bars indicate counts corresponding to H0: ρ = 0, p < 0.05. Positive values in A–D imply that the deviations tended to be larger on trials with more easily discriminable stimuli. E–H, Average deviations (z-scored per choice per session) from blocks of sessions for both monkeys combined (using the same sessions described for Fig. 4A–D), computed as the mean value in 100-ms-wide bins of viewing time offset in steps of 25 ms for each coherence (see inset in E). These plots include only data from correct trials and sessions in which ρ > 0 (from B and D). I–L, Same conventions as in E–H, but using only data from sessions in which ρ < 0. M, N, Best-fitting values of γ1 (and SEMs) from Equation 6b, which quantifies the relationship between deviation magnitude and the strength and duration of the motion stimulus on the given trial, plotted as a function of session number. Lines are linear fits (H0: slope = 0, p < 0.05 in both cases).
Figure 6.
Figure 6.
Mixture model. A, The interquartile range (IQR; i.e., width) of the distribution of deviation magnitude plotted as a function of the median of the distribution for an example session. Each point corresponds to trials binned by the expected value of the decision variable (DV). Increasing values of the DV and therefore easier trials correspond to increasing median magnitudes of deviation. Black symbols are data. Gray symbols are predictions from a mixture model in which the given distribution was generated by taking a mixture of values from the leftmost and rightmost distributions of real data. In all three intermediate cases (excluding the two extremes), the mixture distribution had a similar median value but larger IQR than the corresponding real distribution. B, C, Summary of the mixture-model analysis for monkeys At (B) and Av (C). The ratio of the IQR of a simulated mixture distribution (e.g., gray symbols in A) and the IQR of the real distribution with a similar median value as the mixture distribution (e.g., black symbols in A, excluding the two extremes used to generate the mixtures) is plotted as a function of session number. A value of <1 implies that the actual IQR was smaller than the predicted mixture IQR. Points are medians, and lines indicate extremes for data from individual sessions binned as in A. Robust linear fits of the median values versus session number had a significant, negative slope for Av (solid line in C, p < 0.05) but not At. deg, Degree.
Figure 7.
Figure 7.
The coherence and time dependence of voluntary-saccade latencies. A, C, Scatter plots of Spearman's rank correlation coefficients (ρ) between the trial-by-trial latency and the coherence (abscissa) or viewing time (ordinate) of the motion stimulus. Points indicate values of ρ computed from individual sessions for monkeys At (A) and Av (C) for correct trials. Arrows are medians. B, D, Histograms of ρ between the trial-by-trial latency and the decision variable inferred from behavior on correct, nonmicrostimulation trials computed for individual sessions for At (B) and Av (D). Arrows indicate median values. Gray bars indicate counts corresponding to H0: ρ = 0, p < 0.05. Negative values in A–D imply that latencies tended to be shorter (responses were faster) on trials with more easily discriminable stimuli. E–H, Average latencies (z-scored per choice per session) from correct trials in blocks of sessions for both monkeys combined (using the same sessions described for Fig. 4A–D), computed as the mean value in 100-ms-wide bins of viewing time offset in steps of 25 ms for each coherence (see inset in E). The arrow in each panel indicates the mean viewing time used in the given sessions. I, J, Best-fitting values of γ1 (and SEMs) from Equation 6b, which quantifies the relationship between latency and the strength and duration of the motion stimulus on the given trial, plotted as a function of session number. Lines are linear fits (H0: slope = 0, p < 0.05 in both cases).
Figure 8.
Figure 8.
The coherence and time dependence of voluntary-saccade targeting errors. A, C, Scatter plots of Spearman's rank correlation coefficients (ρ) between the trial-by-trial targeting error and the coherence (abscissa) or viewing time (ordinate) of the motion stimulus. Points indicate values of ρ computed from individual sessions for monkeys At (A) and Av (C) for correct trials. Arrows are medians. B, D, Histograms of ρ between the trial-by-trial targeting error and the decision variable inferred from behavior on correct, nonmicrostimulation trials computed for individual sessions for At (B) and Av (D). Arrows indicate median values. Gray bars indicate counts corresponding to H0: ρ = 0, p < 0.05. Positive values in A–D imply that the saccade endpoints were further from the chosen target on trials with more easily discriminable stimuli. E–H, Average mistargeting magnitude (z-scored per choice per session) from blocks of sessions for both monkeys combined (using the same sessions described for Fig. 4A–D), computed as the mean value in 100-ms-wide bins of viewing time offset in steps of 25 ms for each coherence (see inset in E). These plots include only data from correct trials and sessions in which ρ > 0 (from B and D). I–L, Same conventions as in E–H, but using only data from sessions in which ρ < 0. M, N, Best-fitting values of γ1 (and SEMs) from Equation 6b, which quantifies the relationship between mistargeting magnitude and the strength and duration of the motion stimulus on the given trial, plotted as a function of session number. In both cases, the slope of a weighted linear regression was not significantly different from zero (p > 0.05).
Figure 9.
Figure 9.
Comparison of the motion sensitivity of perceptual and oculomotor data for At (A–D) and Av (E–H). A, E, The motion (coherence and time) dependence of evoked-saccade deviation (|γ1| in Eq. 6b) plotted versus the motion dependence of behavior (a in Eq. 2). B, F, The motion dependence of voluntary-saccade latency plotted versus the motion dependence of behavior. C, G, The motion dependence of voluntary-saccade mistargeting plotted versus the motion dependence of behavior. In A–C and E–G, points represent data from all individual sessions. D, H, Discrimination thresholds measured from behavior (black) and inferred from evoked-saccade deviation (red) and voluntary-saccade latency (green) and mistargeting (blue) data. Thresholds were inferred using the best-fitting, absolute value of γ1 as a parameter in the decision model. Points represent data from individual sessions. Lines are 41-session running means. Points for each data type were rescaled to have equal overall median values; therefore, only the relative trends across sessions are meaningful.

Similar articles

Cited by

References

    1. Audley RJ, Pike AR. Some alternative stochastic models of choice. Br J Math Stat Psychol. 1965;18:207–225.
    1. Ball K, Sekuler R. A specific and enduring improvement in visual motion discrimination. Science. 1982;218:697–698. - PubMed
    1. Ball K, Sekuler R. Direction-specific improvement in motion discrimination. Vision Res. 1987;27:953–965. - PubMed
    1. Bogacz R, Brown E, Moehlis J, Holmes P, Cohen JD. The physics of optimal decision making: a formal analysis of models of performance in two-alternative forced choice tasks. Psychol Rev. 2006;113:700–765. - PubMed
    1. Brainard DH. The psychophysics toolbox. Spat Vis. 1997;10:433–436. - PubMed

Publication types