. 2009 Feb 18;29(7):2151-61.
doi: 10.1523/JNEUROSCI.4660-08.2009.

The cochaperone BAG2 sweeps paired helical filament- insoluble tau from the microtubule

Affiliations

The cochaperone BAG2 sweeps paired helical filament- insoluble tau from the microtubule

Daniel C Carrettiero et al. J Neurosci. .

Abstract

Tau inclusions are a prominent feature of many neurodegenerative diseases including Alzheimer's disease. Their accumulation in neurons as ubiquitinated filaments suggests a failure in the degradation limb of the Tau pathway. The components of a Tau protein triage system consisting of CHIP/Hsp70 and other chaperones have begun to emerge. However, the site of triage and the master regulatory elements are unknown. Here, we report an elegant mechanism of Tau degradation involving the cochaperone BAG2. The BAG2/Hsp70 complex is tethered to the microtubule and this complex can capture and deliver Tau to the proteasome for ubiquitin-independent degradation. This complex preferentially degrades Sarkosyl insoluble Tau and phosphorylated Tau. BAG2 levels in cells are under the physiological control of the microRNA miR-128a, which can tune paired helical filament Tau levels in neurons. Thus, we propose that ubiquitinated Tau inclusions arise due to shunting of Tau degradation toward a less efficient ubiquitin-dependent pathway.


Figures

Figure 1.
Figure 1.
BAG2 reduces Tau levels. A, Neurons were transduced with a Lentivirus at DIV 1 containing a BAG2 RNAi sequence or a Lentivirus containing BAG2. After 8 d, the neurons were fractionated into Sarkosyl soluble and insoluble pools and Tau was detected with PHF-1 and TAU-5 antibodies. COS7 cells were transfected with Tau and BAG2 and 24 h later Sarkosyl soluble and insoluble fractions were purified and detected with PHF-1 and TAU5 antibodies. Blots were quantified by densitometry using ImageJ and the values were normalized to the density of the control experiment (in the absence of BAG2). B, BAG2 overexpression decreased phosphorylated Tau. COS7 cells were transfected as indicated with Tau, BAG2 and BAG2 RNAi for 24 h. Phosphorylated Tau was detected with PHF-1, T181 and S199/202. Total Tau was detected with TAU-5. BAG2 RNAi restored Tau levels. Flag antibody was used to detect overexpression of BAG2-Flag. Bands were quantified as a percentage of the control (black bar, left). Hippocampal cultured neurons were transfected to express BAG2-pEYFP-C1, BAG2 RNAi pEYFP, or nonsilencing pEYFP-C1. BAG2 induced a significant decrease in endogenous Tau levels as shown by immunoblot with Tau antibodies (PHF-1, T181, S199/202 and TAU-5) and conversely BAG2 RNAi increased Tau immunoreactivity with the same antibodies. Bands were quantified as a percentage of the control (black bar, right). Actin was used as a loading control (right). (*p < 0.05, one-way ANOVA and Dunnett's multiple comparison test). Values are shown as ±SEM, n = 3. C, BAG2 levels regulate endogenous Tau in primary hippocampal neurons. Effects of BAG2-pEYFP-C1 (green) or BAG2 RNAi pEYFP-C1 (green) on PHF-1 immunoreactivity (red) in hippocampal neurons (white arrows: cells transfected with a pEYFP-C1 construct; yellow arrows: nontransfected cells). Scale bar, 20 μm. D, COS7 cells were either transfected with Tau or cotransfected with Tau and BAG2 for 16 h; then cells were incubated in the presence of [35S]Met/[35S]Cys mixture for 1 h and incubated up to 28 h in DMEM in an excess of nonlabeled l-methionine and l-cysteine-HCl. Cells were lysed at different chase times and pTau was immunoprecipitated and separated in SDS-PAGE. Radioactivity was detected by exposing the PhosphorImager screen and densitometry of the signal was quantified.
Figure 2.
Figure 2.
BAG2 directs Tau to a Ubiquitin independent pathway. A, BAG2 and PHF-1 coimmunoprecipitate with Hsp70. Primary neuronal rat cultures from hippocampus (HIP) or cortex were infected with BAG2-Flag Lentivirus (+) or an empty Lentivirus (−) at DIV 1 and incubated for 1 week. Cells were lysed and lysates were immunoprecipitated with PHF-1 (top blot) or M2-Agarose Flag (bottom blot). BAG2 and PHF-1 coimmunoprecipitated and HSP70 was detected in the PHF-1/BAG2 complex. B, BAG2 inhibits ubiquitination of tau. Ubiquitinated Tau bands become apparent on a longer exposure blot with TAU-5 (compare 10 s to 15 min exposure). The high molecular weight ubiquitinated Tau bands are nearly eliminated in presence of BAG2 overexpression (top right arrow). The bands were quantified as a percentage of the control (black bar) (*p < 0.05). To prove that the top band is ubiquitinated Tau, the samples were immunoprecipitated with TAU-5 and blotted with a ubiquitin antibody (right panel). The ubiquitin-immunoreactive band comigrated with the high molecular weight band labeled with TAU-5. C, Dominant negative Ubiquitin mutants do not impair BAG2-mediated Tau degradation. COS7 cells were transfected with Tau and BAG2 in the presence of the Ubiquitin mutants, Ub-K48R, Ub-KO, or Ub WT. Twenty-four hours after transfection, lysates were blotted with PHF-1 or TAU-5. Actin was used as a loading control. D, Proteasome inhibition blocks the effects of BAG2. COS-7 cells were transfected with Tau and BAG2 and treated with the proteasomal inhibitor, lactacystin and the caspase inhibitor, Z-VAD in the combinations shown. PHF-1, TAU-5 and Ubiquitin antibodies were used to analyze the samples. Lactacystin blocked the effects of BAG2. The efficacy of lactacystin is shown by the increased ubiquitination in the bottom. The bands were quantified as percentage of the control (Tau in the absence of BAG2). *p < 0.05. Statistical analyses were performed using one-way ANOVA followed by Dunnett's multiple comparison test. Student t test was used to compare the effect of BAG2 on Tau levels at different exposure times. Values are shown as ±SEM, n = 3.
Figure 3.
Figure 3.
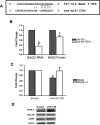
BAG2 is regulated by miR-128a. A, miR-128a predicted target site on BAG2 3′UTR. B, Reduction of BAG2 mRNA in response to miR-128a in neurons. Real-time PCR analysis of BAG2 mRNA showed a significant decrease in BAG2 transcript levels in response to 75 nm pre-miR-128a addition compared with scrambled (*p < 0.05). RNA was harvested 72 h after transfection of DIV 5 neurons. Reduction of BAG2 protein levels in response to miR-128a treatment of COS-7 cells. COS-7 cells were cotransfected with a FLAG-BAG2 expressing vector and pre-mir-128a or a scrambled negative control. Lysates were harvested 24 h after transfection. Values were normalized to actin (*p < 0.05). C, Dual Luciferase reporter assay performed in HeLa cells using Firefly luciferase constructs fused to a 60 bp sequence from the BAG2 3′UTR containing the miR-128a site (BAG2) or a mutant with three altered bases at the seed region (BAG2 mt, underlined in A). Constructs were transfected in conjunction with pre-miR-128a or pre-mir-scram and luciferase activity was normalized to Renilla expression (*p < 0.05). D, Twofold increase of PHF-Tau in miR-128a transfected neurons. DIV 5 neurons were transfected with pre-mir-128a (250 nm) and a negative control Scrambled (250 nm). Lysates were harvested 2 d after transfection. Immunoblot detection of PHF-1, Hsp70, CHIP and actin. The change in PHF-1 tau was normalized to actin and was statistically significant (*p < 0.05) by the Student t test, n = 3.
Figure 4.
Figure 4.
BAG2 colocalizes with Tau. A, Quantification of BAG2/Tau colocalization. BAG2 YFP expression in COS7 is punctate (green, a). α-Tubulin counterstaining with Alexa-594 (red, b) antibody shows a high degree of colocalization of BAG2 with microtubules (c): in the presence of Tau, the number of puncta that colocalize with microtubules increases twofold from 35 to 70% (scale bar, 10 μm). B, (a–c) Cotransfection of pEYFP-C1 BAG2 and Tau pEYFP-C1 into COS7 cells result in BAG2 puncta that align with microtubules 24 h after transfection. eYFP fluorescent markers provided a proportionate signal balance for the two proteins. Images a and b correspond to the red boxed regions in b. Scale bars: (b) 10 μm; (a, c) 2 μm. C, In rat hippocampal neurons, BAG2 distributes with microtubules in a punctate pattern. pEYFP-C1 BAG2 was transfected into primary neurons at DIV 5 and visualized 24 h later. The BAG2 signal extends into both axons and dendrites. Scale bars: (a) 10 μm; (b) 5 μm.
Figure 5.
Figure 5.
BAG2 puncta in COS-7 cells. A, YFP was imaged 20 h after transfection of Tau and BAG2-YFP (scale bar, 10 μm). B, Successive positions of the puncta (imaging frequency: 4 Hz, B corresponds to the region within the white box in A): each color represents one punctum. Over the 75 s acquisition duration, displacement for most puncta is <1 μm. C, Successive positions of a single punctum within the black rectangle. Positions are determined every 250 ms for 300 frames. Point color varies from blue to red with time as follows: color(i) = blue × (1−i/300)+red × i/300; i is frame number with 0 ≤ i ≤ 300 (scale bar, 1 μm). D, Distribution of BAG2 puncta diffusion coefficients (red with Tau, blue without Tau). E, Mobility bias toward linear reversals. Angular distribution of puncta mobility departs significantly, near 180°, from a flat distribution, which would be expected in the case of Brownian motion only (black dash line), suggesting a bias toward a linear motion, most likely along the microtubule (red with Tau, blue without Tau). F, Ratio of two successive probabilities to reverse direction after (i + 1) × 250 ms (red with Tau, blue without Tau). BAG2 puncta have an extremely high reversal rate when observed for up to 500 ms. When apparent forward motion lasted >500 ms (i = 2), the ratio of two successive reversal probabilities was not significantly different from two (dash line), a value expected for a Brownian motion. Error bars represent SEM.
Figure 6.
Figure 6.
Changes of BAG2 mobility properties upon Hsp70 inhibition in COS-7 cells. A, Cumulative loss of puncta with tracking duration. For each punctum, we determined the number of frames during which the punctum can be successfully tracked. Inhibition of Hsp70 using KNK437 induced a highly significant loss of puncta from the focal plane due to their enhanced diffusion. (black: −KNK437; gray: +KNK437). Error bars represent SEM. B, Relative change of the diffusion coefficient D upon treatment with KNK437. KNK437 induced an increase of D both with and without Tau.
Figure 7.
Figure 7.
Model for the role of BAG2 in the regulation of Tau clearance.

References

    1. Ackmann M, Wiech H, Mandelkow E. Nonsaturable binding indicates clustering of tau on the microtubule surface in a paired helical filament-like conformation. J Biol Chem. 2000;275:30335–30343. - PubMed
    1. Alberti S, Demand J, Esser C, Emmerich N, Schild H, Hohfeld J. Ubiquitylation of BAG-1 suggests a novel regulatory mechanism during the sorting of chaperone substrates to the proteasome. J Biol Chem. 2002;277:45920–45927. - PubMed
    1. Arndt V, Daniel C, Nastainczyk W, Alberti S, Höhfeld J. BAG-2 acts as an inhibitor of the chaperone-associated ubiquitin ligase CHIP. Mol Biol Cell. 2005;16:5891–5900. - PMC - PubMed
    1. Asher G, Lotem J, Kama R, Sachs L, Shaul Y. NQO1 stabilizes p53 through a distinct pathway. Proc Natl Acad Sci U S A. 2002;99:3099–3104. - PMC - PubMed
    1. Ballatore C, Lee VM, Trojanowski JQ. Tau-mediated neurodegeneration in Alzheimer's disease and related disorders. Nat Rev Neurosci. 2007;8:663–672. - PubMed

Publication types

MeSH terms