. 2009 Feb 18;29(7):2212-24.
doi: 10.1523/JNEUROSCI.4184-08.2009.

Genetics of brain fiber architecture and intellectual performance

Affiliations

Genetics of brain fiber architecture and intellectual performance

Ming-Chang Chiang et al. J Neurosci. .

Abstract

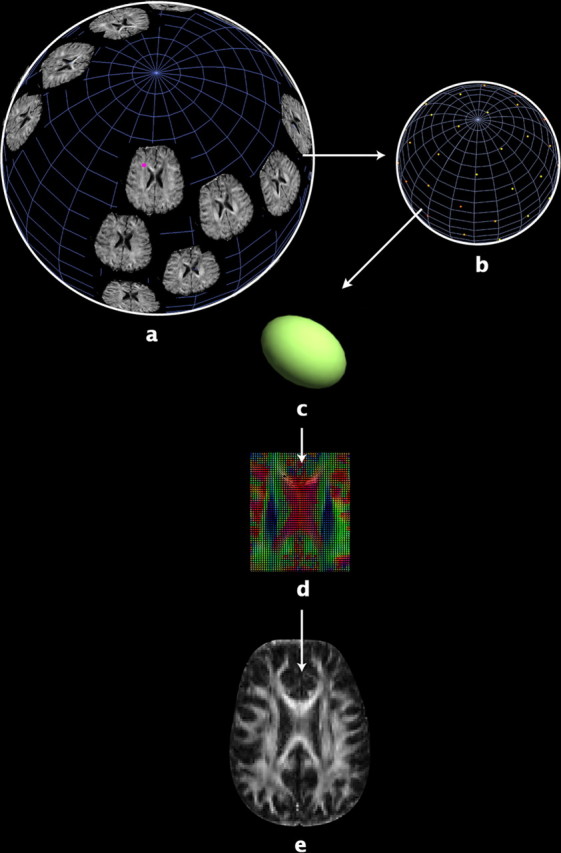
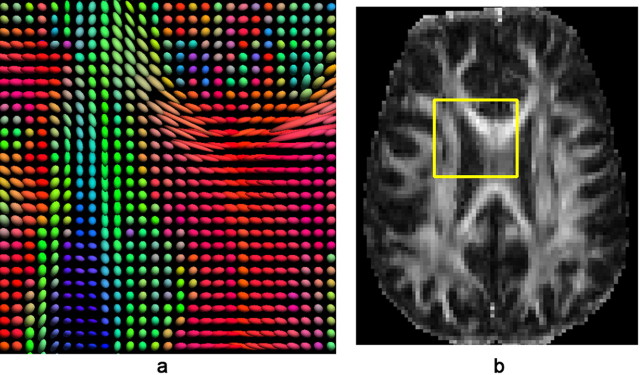
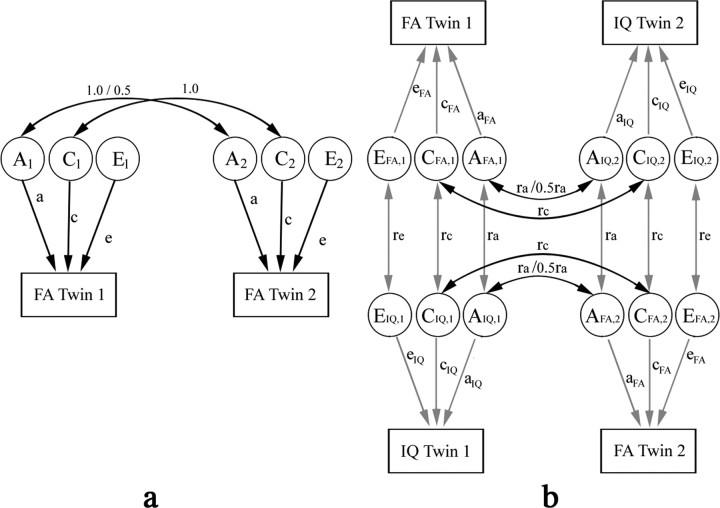
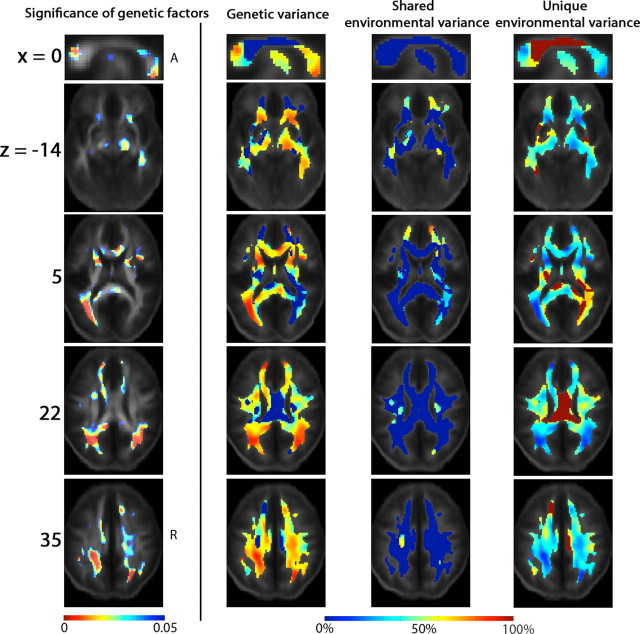
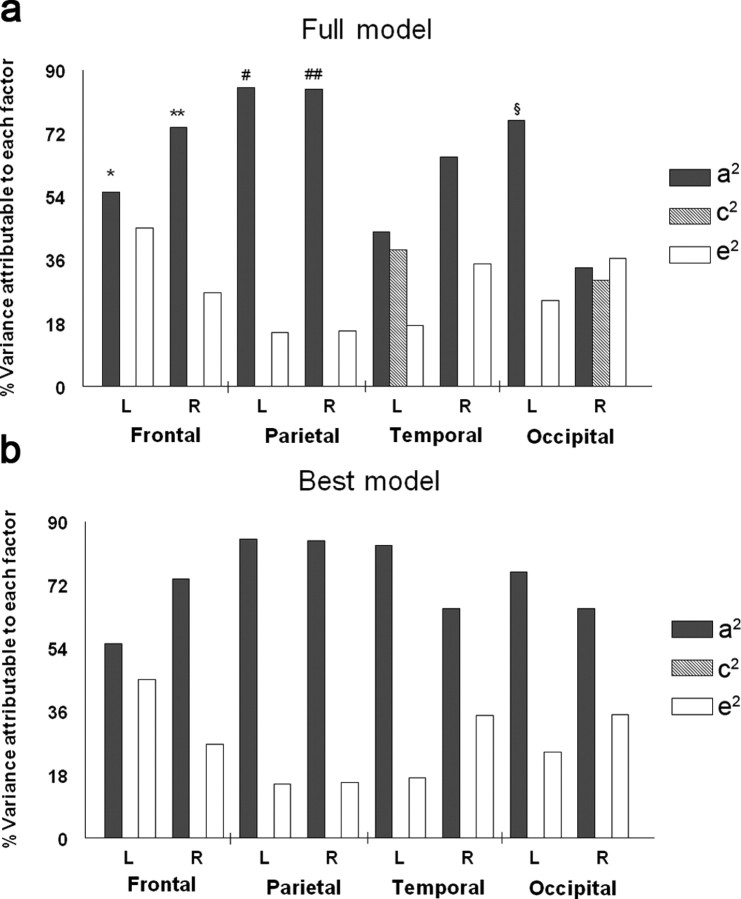
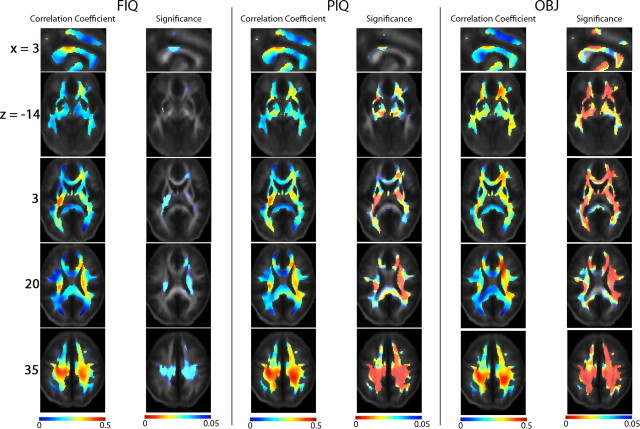
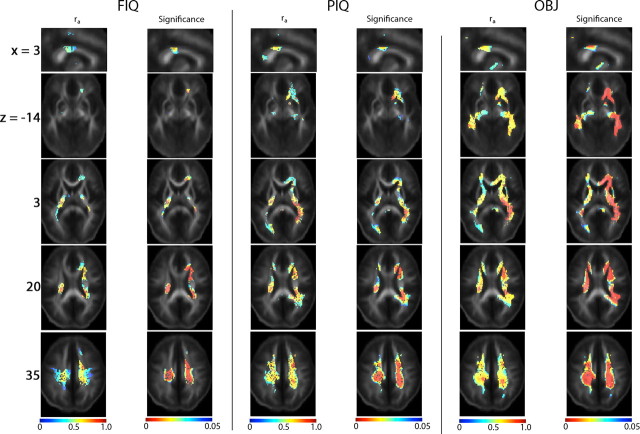
The study is the first to analyze genetic and environmental factors that affect brain fiber architecture and its genetic linkage with cognitive function. We assessed white matter integrity voxelwise using diffusion tensor imaging at high magnetic field (4 Tesla), in 92 identical and fraternal twins. White matter integrity, quantified using fractional anisotropy (FA), was used to fit structural equation models (SEM) at each point in the brain, generating three-dimensional maps of heritability. We visualized the anatomical profile of correlations between white matter integrity and full-scale, verbal, and performance intelligence quotients (FIQ, VIQ, and PIQ). White matter integrity (FA) was under strong genetic control and was highly heritable in bilateral frontal (a(2)=0.55, p=0.04, left; a(2)=0.74, p=0.006, right), bilateral parietal (a(2)=0.85, p<0.001, left; a(2)=0.84, p<0.001, right), and left occipital (a(2)=0.76, p=0.003) lobes, and was correlated with FIQ and PIQ in the cingulum, optic radiations, superior fronto-occipital fasciculus, internal capsule, callosal isthmus, and the corona radiata (p=0.04 for FIQ and p=0.01 for PIQ, corrected for multiple comparisons). In a cross-trait mapping approach, common genetic factors mediated the correlation between IQ and white matter integrity, suggesting a common physiological mechanism for both, and common genetic determination. These genetic brain maps reveal heritable aspects of white matter integrity and should expedite the discovery of single-nucleotide polymorphisms affecting fiber connectivity and cognition.


Figures

Figure 1.
Figure 1.
a, In DTI, a set of diffusion-sensitized images is acquired, with diffusion-sensitizing magnetic field gradients of the same strength, but oriented in different directions on an imaginary sphere. Each voxel in DTI contains multidimensional data (in our study, the dimension is 27). For example, b shows the raw diffusion data from a single voxel (the pink point in a) in all diffusion-weighted images from one of the subjects. Water diffusion is antipodally symmetric along a specific direction, so one diffusion-sensitized image gives a pair of data points with identical values on the sphere. Each point on the sphere indicates the MR signal attenuation caused by water diffusion in the direction of the corresponding diffusion gradient, with greater signal attenuation (color-coded as red; magnitude of MR signal attenuation increases from yellow to red) indicating more rapid rates of water diffusion along that gradient direction. Water diffusion can be estimated by fitting the raw diffusion data in b to a diffusion ellipsoid (c), whose axes correspond to the eigenvalue-eigenvector pairs of a diffusion tensor (Basser and Pierpaoli, 1996). An image of the diffusion tensors estimated from all the voxels of the raw diffusion data is displayed in d (see Fig. 2 for details). Analysis of DTI scans is computationally expensive due to their high information content, especially for the covariance structure analysis in twin studies, so it is more practical to first estimate anisotropy maps of scalar values, such as FA (e).
Figure 2.
Figure 2.
The image of diffusion tensors (a) selected from the brain region at the junction of the corpus callosum and the corona radiata, shown as the yellow box in the corresponding FA image (b) of the same subject as in Figure 1. Diffusion tensors are visualized as ellipsoids (which have been normalized to unit mass) that are color coded, as is conventional, to represent the orientation of the normalized principal eigenvector (dominant direction of water diffusion) relative to the medial–lateral axis (coded in red), anterior–posterior axis (coded in green), and superior–inferior axis (coded in blue) of the anatomical reference frame. Glyphs of tensor ellipsoids were generated using the visualization software “BrainSuite” (http://www.loni.ucla.edu/Software/) (Shattuck et al., 2008).
Figure 3.
Figure 3.
Path diagrams for (a) univariate (for FA) and (b) bivariate cross-trait (for FA and IQ) structural equation models (a and b are adapted from Neale et al., (1992) and Miles et al., (2002) respectively. a, Each twin's phenotypic measure (e.g., FA in this study) is assumed to be determined by additive genetic (A) and environment factors. Environmental factors are further subdivided into those that the co-twins share (denoted by C, e.g., family rearing environment, and common developmental factors in utero), and those that are unique for each twin (denoted by E, e.g., they may be educated at different schools). Contributions of the ACE factors to the phenotype are indicated by single arrows and assumed to be the same between co-twins (twin 1 and twin 2) for simplification, with their weights, or path coefficients, denoted by a, c, and e, respectively. Random noise, or experimental measurement error, is included in component E, and assumed to be independent between twin 1 and 2 (no correlation). Correlations in the genetic and shared environmental factors between co-twins are indicated by double arrows. For A1 and A2, the correlation coefficient is equal to 1 for MZ and 0.5 for DZ twin pairs. The correlation coefficient between C1 and C2 is always 1 from the definition of the shared environment. b, In bivariate cross-trait SEM, we assume that there are common genetic and environmental factors that affect various phenotypes within an individual. Here, we only consider factors that affect two phenotypes, such as FA and IQ. The effects of these common factors are estimated by comparing the difference between MZ and DZ pairs, in the correlation between the two phenotypes within the same individual (cross-trait within-individual), and also in the correlation between one phenotype in one twin, and the other phenotype in the other twin (cross-trait cross-twin). The cross-trait within-individual correlation (the correlation between FA and IQ in twin 1 or in twin 2, shown as connected by gray arrows) is divided into additive genetic, and shared and unique environmental components (e.g., AFA, i, CFA, i, and EFA, i for FA, and AIQ, i, CIQ, i, and EIQ, i for IQ; i = 1 or 2 for twin 1 or 2), and the correlation coefficients between AFA, i and AIQ, i, CFA, i and CIQ, i, and EFA, i and EIQ, i, are denoted by ra, rc, and re, respectively. The cross-trait cross-twin correlation is shown as AFA, i and AIQ, j, and CFA, i and CIQ, j connected by black arrows, for FA in twin i and IQ in twin j, where i, j = 1 or 2, and ij. There is no re term for EFA, i and EIQ, j, because the unique environmental factors between subjects are not correlated. The covariance across the two phenotypes within the same subject, or separately in the two subjects, is then derived by multiplication of the path coefficients for the closed paths in the path diagram. For example, covariance between FA in twin 1 and IQ in twin 2 is equal to aFA·ra·aIQ+cFA·rc·cIQ for MZ twins, and aFA·1/2ra·aIQ+cFA·rc·cIQ for DZ twins. This implies that any excess in cross-trait cross-twin correlation in MZ twins over that in DZ twins is attributed to common genetic factors that affect both FA and IQ. Correlations for the same phenotype (FA or IQ) between co-twins, as have already been described in a, are not shown for simplification.
Figure 4.
Figure 4.
Maps of genetic influences on white matter integrity. These maps show how different factors, genetic or environmental, explain different proportions of the observed variance in white matter integrity across 92 subjects. The Montreal Neurological Institute (MNI) coordinate (which is also the coordinate used in the ICBM space; expressed in mm) of the slices is indicated at the beginning of each row. The first column shows the statistical significance of the genetic influences (p(A), FDR-adjusted), and the proportional contributions to the overall variance in FA, from genetic (a2), shared environmental (c2) and unique environmental (e2) factors (the second to the last columns, computed under the best-fitting statistical model). The genetic effect is detected in the genu and the splenium of the corpus callosum (x = 0), the right cerebral peduncle, and right ILF/IFO (z = −14), the anterior limbs of the internal capsule bilaterally, and the left posterior thalamic radiation/optic radiation (z = 5), the superior longitudinal fasciculus bilaterally (z = 22), and the superior and posterior corona radiata bilaterally (z = 35). A, Anterior; R, right.
Figure 5.
Figure 5.
Proportions of variance in white matter integrity in different lobes of the brain (average lobar values of FA) due to genetic (a2), shared environment (c2) and unique environment (e2) components, under the full (a) and the best-fitting model (b). For each lobe, the average FA in white matter (defined as FA >0.3) served as the observed variable for the ACE structural equation models. *p(A) = 0.04; **p(A) = 0.006, #p(A) < 0.001; ##p(A) < 0.001; §p(A) = 0.003. p(A) in other lobes and p(C) are not significant. These data show the dominant effect of genes on white matter integrity and provide little evidence to support a strong environmental effect (that is independent of genetic variation). L, Left; R, right.
Figure 6.
Figure 6.
Association between FA and FIQ, PIQ and OBJ. Partial correlation coefficients are shown between white matter integrity (measured using FA) and the intellectual performance scores: FIQ, PIQ, and OBJ. The MNI coordinate (mm) of the slices is indicated at the beginning of each row. All statistics are controlled for age and sex, and are computed voxelwise for subjects randomly selected, one from each pair (the left column in each group shows the correlation coefficient, and the right column shows its significance). Overall significance is measured by FDR-adjusted p values obtained from the random-effects regression model (RRM), as RRM also estimated the effect of twin pairing. Significant positive correlation between FA and FIQ, PIQ or OBJ was detected in the isthmus of the corpus callosum and the cingulum bundle (x = 3), the bilateral cerebral peduncles (for PIQ and OBJ) and ILF/IFO (for the object assembly test, OBJ) (z = −14), the posterior limbs of the internal capsule bilaterally and left posterior thalamic radiation/optic radiation (z = 3), the anterior corona radiata and right superior fronto-occipital fasciculus (z = 20), and the superior and posterior corona radiata bilaterally (z = 35). Negative correlations were not significant. Regions where FA is associated with OBJ are the most extensive and have the greatest effect sizes.
Figure 7.
Figure 7.
Cross-trait genetic correlations between FA and FIQ, PIQ and OBJ scores, with maps of correlation coefficients ra, corrected for age and sex (left), and the FDR-adjusted values for the significance of ra (right). The MNI coordinate (mm) of the slices is indicated at the beginning of each row. For each of these IQ scores, cross-trait analysis was limited to the brain regions where phenotypic correlation between FA and that IQ score was significant. Common genetic factors affect both FA and FIQ, PIQ or OBJ in the cingulum and isthmus of the corpus callosum, a commissural pathway innervating the parietal cortex, which is crucial for multi-modal sensory integration (x = 3), the cerebral peduncles (for OBJ) and ILF/IFO (right > left, for OBJ) (z = −14), the posterior limbs of the internal capsule and the left posterior thalamic radiation/optic radiation (for PIQ and OBJ) (z = 3), bilateral anterior corona radiata and right superior fronto-occipital fasciculus (z = 20), and bilateral superior and posterior corona radiata (for PIQ and OBJ) (z = 35). There were no negative genetic correlations between IQ scores and white matter integrity, i.e., negative values of ra were not significant.

References

    1. Aboitiz F. The origin of the mammalian brain as a case of evolutionary irreversibility. Med Hypotheses. 1992;38:301–304. - PubMed
    1. Alexander DC, Pierpaoli C, Basser PJ, Gee JC. Spatial transformations of diffusion tensor magnetic resonance. IEEE Trans Med Imaging. 2001;20:1131–1139. - PubMed
    1. Arbuthnott ER, Boyd IA, Kalu KU. Ultrastructural dimensions of myelinated peripheral nerve fibres in the cat and their relation to conduction velocity. J Physiol. 1980;308:125–157. - PMC - PubMed
    1. Arsigny V, Fillard P, Pennec X, Ayache N. Fast and simple calculus on tensors in the log-Euclidean framework. Paper presented at the 8th International Conference on Medical Image Computing and Computer Assisted Intervention (MICCAI); October; California: Palm Springs; 2005. - PubMed
    1. Basser PJ, Pierpaoli C. Microstructural and physiological features of tissues elucidated by quantitative-diffusion-tensor MRI. J Magn Reson B. 1996;111:209–219. - PubMed

Publication types

MeSH terms

LinkOut - more resources