. 2009 Mar 27;104(6):796-804.
doi: 10.1161/CIRCRESAHA.108.187005. Epub 2009 Feb 19.

Mechanistic insights into nitrite-induced cardioprotection using an integrated metabolomic/proteomic approach

Affiliations

Mechanistic insights into nitrite-induced cardioprotection using an integrated metabolomic/proteomic approach

David H Perlman et al. Circ Res. .

Abstract

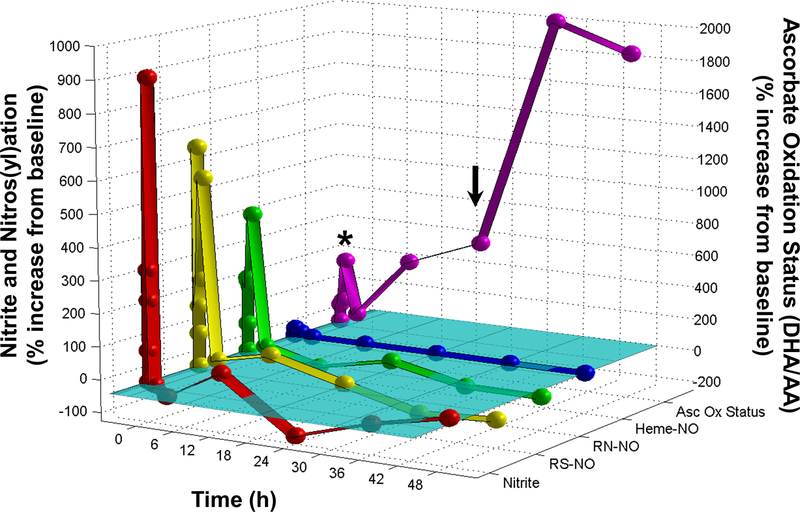
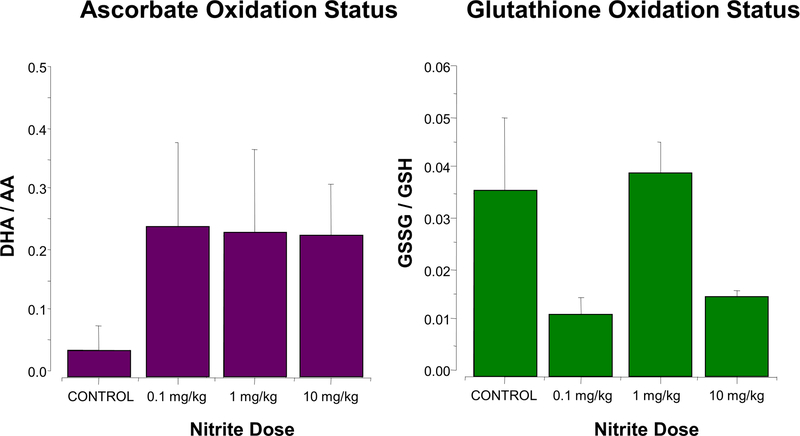
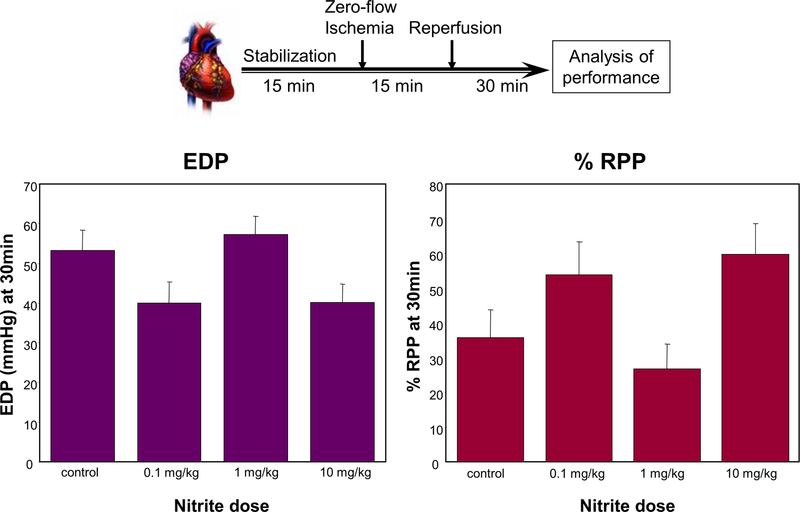
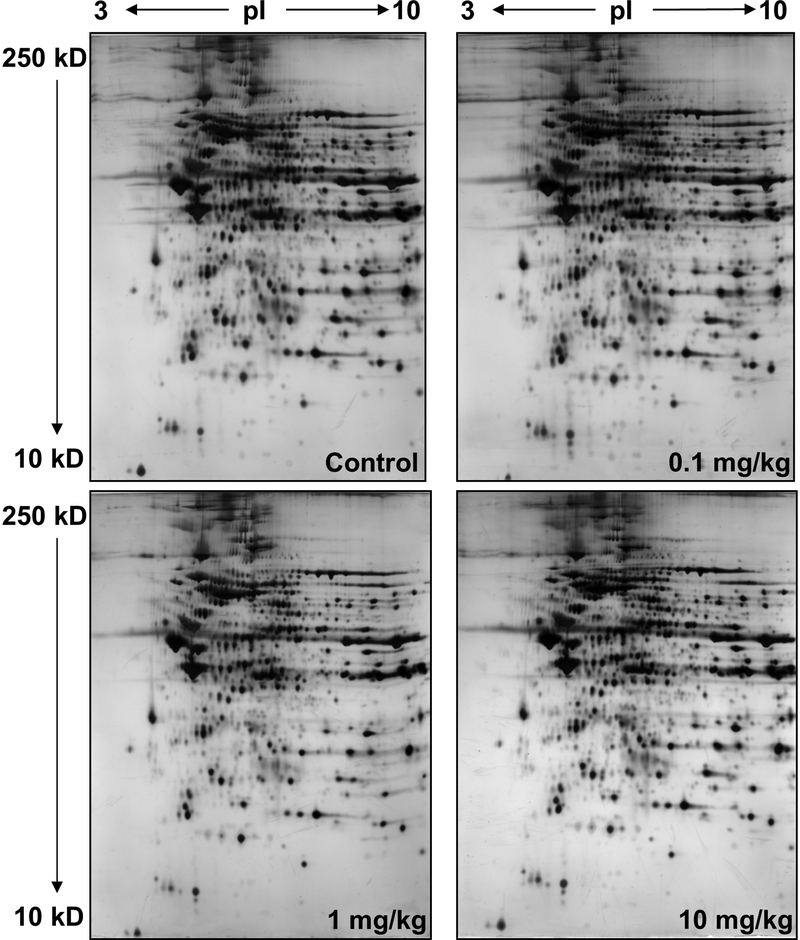
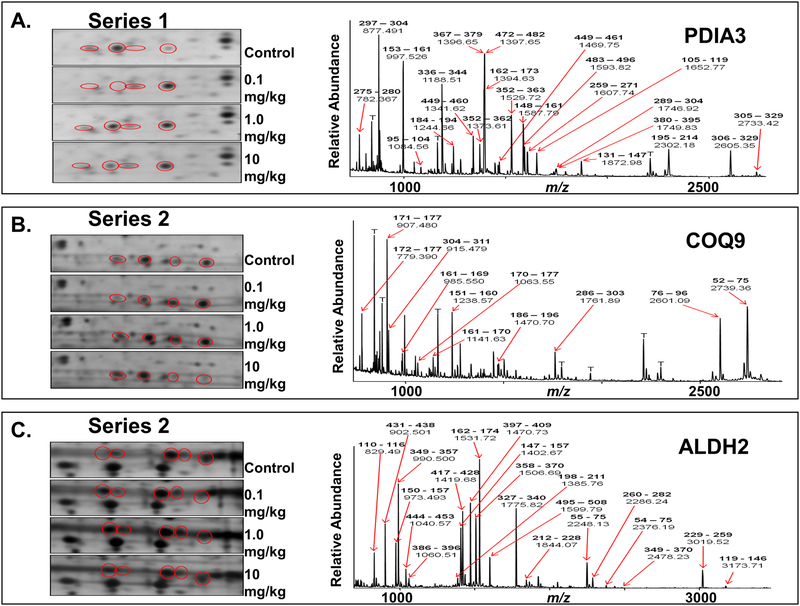
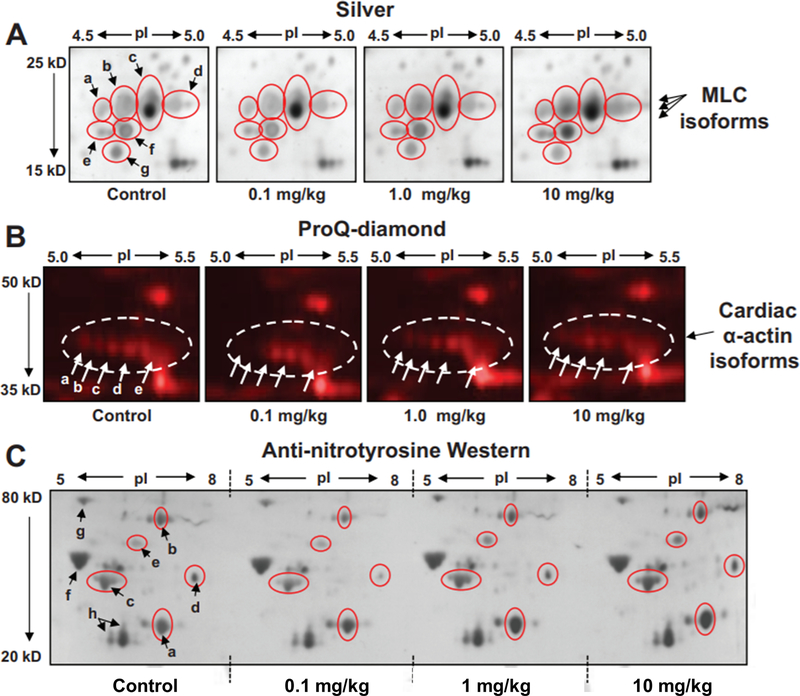
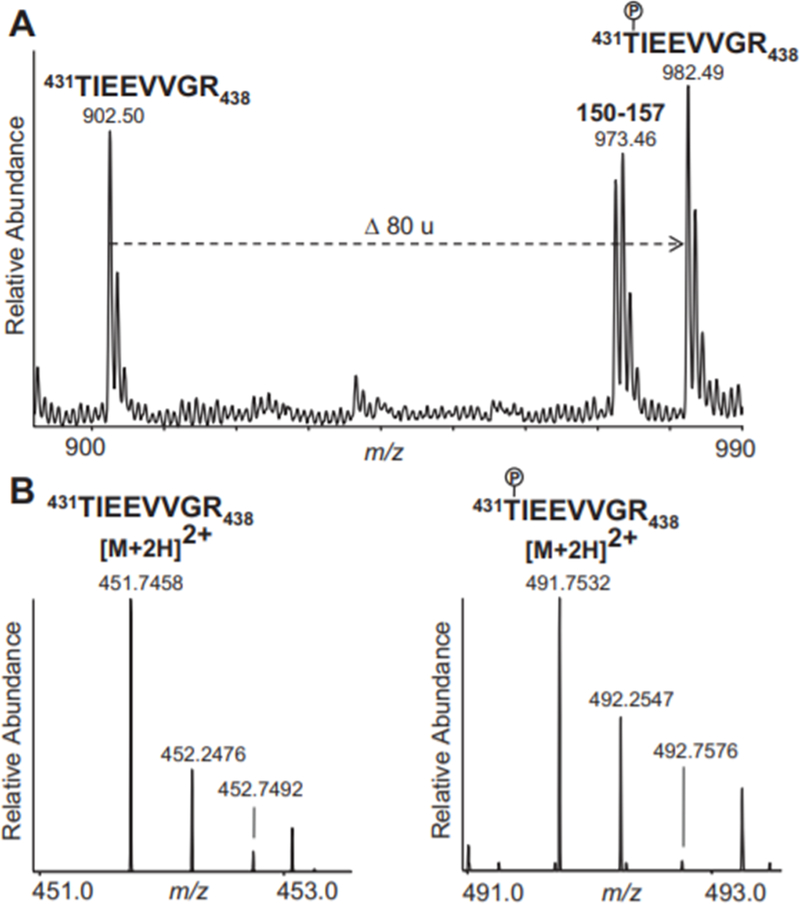
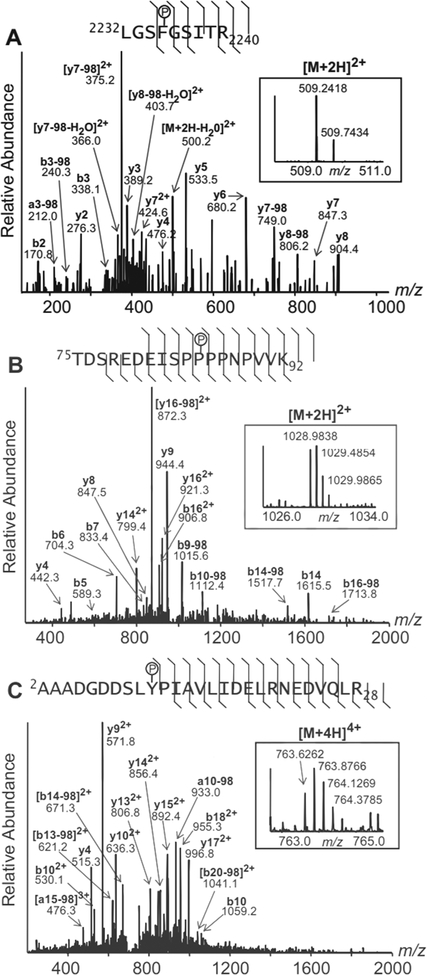
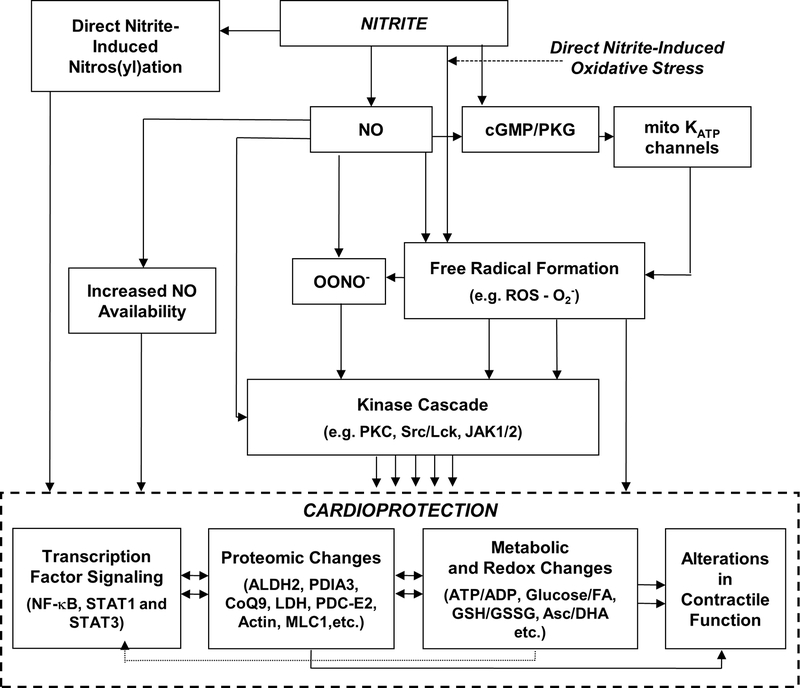
Nitrite has recently emerged as an important bioactive molecule, capable of conferring cardioprotection and a variety of other benefits in the cardiovascular system and elsewhere. The mechanisms by which it accomplishes these functions remain largely unclear. To characterize the dose response and corresponding cardiac sequelae of transient systemic elevations of nitrite, we assessed the time course of oxidation/nitros(yl)ation, as well as the metabolomic, proteomic, and associated functional changes in rat hearts following acute exposure to nitrite in vivo. Transient systemic nitrite elevations resulted in: (1) rapid formation of nitroso and nitrosyl species; (2) moderate short-term changes in cardiac redox status; (3) a pronounced increase in selective manifestations of long-term oxidative stress as evidenced by cardiac ascorbate oxidation, persisting long after changes in nitrite-related metabolites had normalized; (4) lasting reductions in glutathione oxidation (GSSG/GSH) and remarkably concordant nitrite-induced cardioprotection, which both followed a complex dose-response profile; and (5) significant nitrite-induced protein modifications (including phosphorylation) revealed by mass spectrometry-based proteomic studies. Altered proteins included those involved in metabolism (eg, aldehyde dehydrogenase 2, ubiquinone biosynthesis protein CoQ9, lactate dehydrogenase B), redox regulation (eg, protein disulfide isomerase A3), contractile function (eg, filamin-C), and serine/threonine kinase signaling (eg, protein kinase A R1alpha, protein phosphatase 2A A R1-alpha). Thus, brief elevations in plasma nitrite trigger a concerted cardioprotective response characterized by persistent changes in cardiac metabolism, redox stress, and alterations in myocardial signaling. These findings help elucidate possible mechanisms of nitrite-induced cardioprotection and have implications for nitrite dosing in therapeutic regimens.


Figures

Figure 1.
Figure 1.. Major, long-term perturbation of cardiac redox tone following brief elevations in nitrite.
Detailed examination of the levels of cardiac nitrite, S- and N- nitroso and heme-nitrosyl species, and ascorbate oxidation status through time after a brief systemic nitrite elevation. Hearts from animals administered a bolus dose of nitrite (1 mg/kg) by intraperitoneal injection were analyzed after 0, 2, 5, 10, and 30 min, and 1, 3, 12, 24, 36, and 48 h. Cardiac nitrite levels were determined by ion chromatography; S-nitrosothiol (RS-NO), N-nitrosamine (RN-NO) and heme nitrosylation (heme-NO) levels were determined by gas-phase chemiluminescence; the ascorbate oxidation status, i.e. the ratio of dehydroascorbate (DHA) over ascorbic acid (AA), was determined by spectrophotometry. Values are normalized as percent change from baseline, which is indicated by the cyan plane. Left axis, nitrite and nitros(yl)ation scale; right axis, ascorbate oxidation status scale. The asterisk indicates the brief elevation in ascorbate oxidation status that accompanies the spike in cardiac nitrite levels, while the arrow indicates the 24 h value during the subsequent protracted elevation of the ascorbate oxidation status (mean values of 3 animals/time point; error bars omitted for sake of clarity). Errors were all < ± 15 %.
Figure 2.
Figure 2.. Complex dose-response of nitrite-induced long-term perturbations in cardiac redox tone and in cardiac preconditioning.
(A) Ascorbate oxidation uniformly increases in response to nitrite 24 h post administration, whereas the dose-response relationship of glutathione oxidation status is complex. Hearts from animals administered a bolus dose of nitrite (0.1, 1.0, 10 mg/kg nitrite, or saline (control)) by intraperitoneal injection were analyzed after 24 h: the ascorbate oxidation status (DHA/AA) (left panel) and glutathione oxidation status (GSSG/GSH) (right panel) were determined by spectrophotometric methods (means ± SEM; n = 3). (B) Dose-dependent cardioprotective or detrimental preconditioning by nitrite. Hearts, isolated from animals 24 h after administration of a bolus dose of nitrite (0.1, 1.0, 10 mg/kg nitrite, or saline (control)), were perfused in the Langendorff mode, subjected to ex vivo ischemia/reperfusion, and monitored for recovery of contractile function: after 15 min of stabilization, hearts were subjected to 15 min of global ischemia, followed by 30 min of reperfusion, at which time end diastolic pressure (EDP), rate/pressure product (RPP) and other hemodynamic parameters were measured (mean values ± SEM; n = 4–5).
Figure 3.
Figure 3.. Nitrite-induced alterations to cardiac mitochondrial-associated proteins, PDIA3, COQ9, and ALDH2, revealed by differential 2D-PAGE and MS analyses.
Hearts from animals administered a bolus dose of nitrite (0.1, 1.0, 10 mg/kg nitrite, or saline (control)) were isolated 24 h post administration, homogenized and subjected to differential centrifugation to isolate mitochondria and post-mitochondrial cytoplasmic supernatant. Protein was subjected to 2D-PAGE and visualized by silver staining. All samples were pooled from 3 animals per dose; gels are representative of a minimum of three replicates. (A) Purified cardiac mitochondria (50 μg), subjected to 2D-PAGE over the pI range 3–10 and molecular weight (mw) range of approximately 250–10 kD, as indicated (shown to display uniformity of preparation and staining). (B) Enlargments across treatment groups of 3 regions of 2D gels run with the same mitochondrial material as in (A) over the pI range 4–7 and mw range of approximately 250–10 kD (enlargements, left panels; full gels, Fig. S-2, Online Data Supplement). Spots circled in red are constituents that appeared to be grossly differentially expressed at different levels of nitrite exposure. (i) Series 1, train of 4 spots, labeled a-d, at ca. pI 6 and mw 60 kD. (ii) Series 2, train of 4 spots, labeled a-d, at ca. pI 5 and mw 30 kD. (iii) Series 3, train of 5 spots, labeled a-e, at ca. pI 6.3 and mw 57 kD. A summary of the changes observed in these 3 series of spots can be found in Table 2 (Online Data Supplement). The same spots from equivalent 2D–PAGE gels (using ~10-fold more protein) stained with Coomassie blue were excised and subjected to in-gel digestion. Eluted peptides were analyzed by MALDI-TOF MS, and resultant spectra (right panels; spectra shown for one spot in each series over the approximate range m/z 700–3000) were analyzed to generate peptide ion peak lists that were submitted to the on-line database search engine, Mascot™, for peptide mass fingerprint analyses against the rat proteomic database. Spots series 1, 2, and 3, were determined to consist of isoforms of protein disulfide isomerase A3 (Mascot score, 221; expect value 1.6 × 10⁻¹⁸), ubiquinone biosynthesis protein CoQ9 (Mascot score, 79; expect value 8.6 × 10⁻⁵), and aldehyde dehydrogenase 2 (Mascot score, 205; expect value 6.2 × 10⁻¹⁷), respectively. Prominent peptide ions are labeled in the spectra with their observed m/z values and corresponding amino acid intervals (bold) within the sequence of the assigned proteins. T, trypsin autolysis peptide.
Figure 4.
Figure 4.. Alterations to other cardiac proteins, including myofilament, energetic, and signaling proteins induced by brief nitrite exposure.
Post-mitochondrial cytoplasmic supernatant purified by differential centrifugation from the cardiac tissue of animals administered a bolus dose of 0.1, 1.0, 10 mg/kg nitrite, or saline (control), as described, was analyzed by 2D-PAGE over the pI range 4–7 and molecular weight range of 250–10 kD. Shown here (A) are enlargements of the myosin light chain 1 (MLC1) region displaying differential changes in isoform expression (spots a-g, circled in red) depending on nitrite dose. (B) Equivalent gels were run and stained with the phosphoprotein-sensitive fluorescent dye, ProQ-Diamond™. Shown are enlargements of the actin region (actin circled) displaying differential changes in actin migrational isoforms (spots labeled a-e) according to nitrite dose. (C) Changes in protein nitration due to acute nitrite exposure. Equivalent amounts of cardiac tissue homogenate from animals administered a bolus dose of 0.1, 1.0, 10 mg/kg nitrite, or saline (control), were analyzed by IEF over the pI range 3–10. IEF strips were trimmed to pI ranges of 5–8 and then placed alongside one another atop a single second dimension gel and subjected to SDS-PAGE followed by Western blotting of a single membrane using anti-nitrotyrosine anti-sera. Shown is the 2D-Western blot over the molecular weight range of 80–20 kD. Nitrotyrosine–related immunoreactive protein spots a-h (a-e, changing with nitrite dose, circled in red). a) lactate dehydrogenase B (LDH), b) dehydrolipamide S-acetyl transferase (PDC-E2), c) actin, d) & e) unidentified cardiac proteins, f) F1 ATPase beta subunit, g) GRP78, h) MLC isoforms.
Figure 5.
Figure 5.. Phosphorylated and non-phosphorylated forms of ALDH2 peptide 431TIEEVVGR438 detected by MS analyses.
Ions are labeled with their detected m/z values. The phosphorylated Thr431 residue is indicated on the sequences with a P inside a circle. (A) MALDI-TOF mass spectrum of peptides from a spot assigned by PMF to ALDH2 in the 2D-PAGE analysis of mitochondria from nitrite-treated animals (as in Fig 3Biii, spot b), shown over the range m/z 900–990. Labeled are the unmodified ALDH2 peptide, 431–438, the phosphorylated species of the same peptide (the shift of 80 u corresponding to the addition of a phosphate group), and another ALDH2 peptide, 150–157. (B) ESI mass spectra recorded during LC-MS analysis of peptides that were isolated, through in-solution digestion and phosphopeptide enrichment, directly from pooled heart homogenates of nitrite-treated animals. Shown are regions of the mass spectra containing the [M+2H]2+ molecular ions assigned to the unmodified (left panel; displaying the range m/z 451.0–453.0) and the phosphorylated (right panel; displaying the range m/z 491.0–493.0) species of the ALDH2 peptide, 431–438.
Figure 6.
Figure 6.. Phosphospecies of filamin-C, PKA, and PP2A subunits detected differentially in heart homogentes of nitrite-treated animals.
Tandem mass spectra from three phosphopeptides which were present differentially in homogenates of nitrite-treated animals. (A) Filamin-C (FLNC) phosphopeptide corresponding to amino acids 2232–2240, containing phosphorylated Ser2234 ([M+2H]2+ m/z 509.2418). (B) PKA Regulatory Subunit 1-alpha (KAP0) phosphopeptide, corresponding to amino acids 75–92, containing phosphorylated Ser83 ([M+2H]2+ m/z 1028.9838). (C) PP2A Regulatory Subunit A-alpha (2AAA) phosphopeptide, corresponding to amino acids 2–28, containing phosphorylated Ser9 ([M+4H]4+ m/z 763.6262). Precursor ion spectra are shown inset into the product ion spectra (both over the indicated m/z ranges). The precursor ions and prominent fragment ions are labeled in the spectra with their observed m/z values; where applicable, their corresponding b/y-ion designations, charge states, and neutral losses of phosphoric acid (−98) are labeled (bold). A summary of the fragment ion data, including the less abundant fragment ions detected, is indicated on the phosphopeptide sequence above each spectrum. In each case, the site of phosphorylation (indicated with a P inside a circle) is identified unambiguously by numerous prominent diagnostic b- and/or y- ions.
Figure 7.
Figure 7.. Schematic representation of the mechanisms underlying nitrite-induced late preconditioning.
Nitrite, both directly and through the release of NO, induces the release of free radicals, including reactive oxygen species (ROS). One mechanism leading to the increase in ROS includes NO-induced activation of cyclic GMP (cGMP) which in turn activates a redox-sensitive protein kinase G (PKG); this opens mitochondrial KATP channels, enhancing local ROS production. NO, ROS and peroxynitrite (OONO), when produced in an optimal balance resulting from effective nitrite concentrations and incipient conditions (e.g. cellular redox status), lead to activation of cellular kinases (e.g. PKA, PKC δ and ε). Nitrite-derived NO can also act via transient modification of components of the electron transport chain and S-nitrosation of proteins involved in regulation of mitochondrial energetics. Ultimately, these lead to cardioprotection mediated through the interplay of transcription factor signaling, proteomic, metabolic, and redox changes, and alterations in contractile function.

References

    1. Mazzone M, Carmeliet P. Drug discovery: a lifeline for suffocating tissues. Nature. 2008;453:1194–1195. - PubMed
    1. Zweier JL, Wang P, Samouilov A, Kuppusamy P. Enzyme-independent formation of nitric oxide in biological tissues. Nat Med. 1995;1:804–809. - PubMed
    1. Lundberg JO, Weitzberg E, Gladwin MT. The nitrate-nitrite-nitric oxide pathway in physiology and therapeutics. Nat Rev Drug Discov. 2008;7:156–167. - PubMed
    1. Cosby K, Partovi KS, Crawford JH, Patel RP, Reiter CD, Martyr S, Yang BK, Waclawiw MA, Zalos G, Xu X, Huang KT, Shields H, Kim-Shapiro DB, Schechter AN, Cannon RO III, Gladwin MT. Nitrite reduction to nitric oxide by deoxyhemoglobin vasodilates the human circulation. Nat Med. 2003;9:1498–1505. - PubMed
    1. Maher AR, Milsom AB, Gunaruwan P, Abozguia K, Ahmed I, Weaver RA, Thomas P, Ashrafian H, Born GV, James PE, Frenneaux MP. Hypoxic modulation of exogenous nitrite-induced vasodilation in humans. Circulation. 2008;117:670–677. - PubMed

Publication types