. 2009 Mar;119(3):551-64.
doi: 10.1172/JCI36604. Epub 2009 Feb 23.

PD-L1 negatively regulates CD4+CD25+Foxp3+ Tregs by limiting STAT-5 phosphorylation in patients chronically infected with HCV

Affiliations

PD-L1 negatively regulates CD4+CD25+Foxp3+ Tregs by limiting STAT-5 phosphorylation in patients chronically infected with HCV

Debora Franceschini et al. J Clin Invest. 2009 Mar.

Abstract

CD4+CD25+Foxp3+ Tregs suppress autoimmune responses. In addition, they limit T cell responses during chronic infection, thereby minimizing T cell-dependent immunopathology. We sought to investigate how Tregs are regulated in the livers of patients chronically infected with HCV, where they control the balance between an adequate protective immune response and suppression of immunopathology. We found that, despite accumulating and proliferating at sites of infection in the livers of patients chronically infected with HCV, Tregs were relatively less expanded than CD4+CD25+Foxp3- effector T cells. The relative lower expansion of intrahepatic Tregs coincided with their upregulation of programmed death-1 (PD-1). PD-1 expression inversely correlated with both Treg proliferation and clinical markers of immune suppression in vivo. Consistent with the possibility that PD-1 controls Tregs, blockade of the interaction between PD-1 and programmed death-1 ligand 1 (PD-L1) enhanced the in vitro expansion and function of Tregs isolated from the livers of patients chronically infected with HCV. Blockade of the interaction between PD-L1 and B7.1 also improved the proliferation of these cells. Interestingly, both PD-1 and phosphorylated STAT-5 were overexpressed in intrahepatic Tregs in a parallel fashion in steady disease conditions, and in an alternate-fluctuating fashion during the course of severe hepatitis reactivation. Notably, PD-L1 blockade upregulated STAT-5 phosphorylation in Tregs ex vivo. These data suggest that PD-L1 negatively regulates Tregs at sites of chronic inflammation by controlling STAT-5 phosphorylation.


Figures

Figure 1
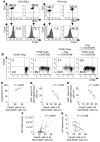
Figure 1. Treg and Teff repertoire in liver and peripheral blood of HCV patients.
(A) Representative flow cytometry analyses of HD-PBLs, HCV-PBLs, or HCV-IHLs stained with mAbs to CD4, CD25, and Foxp3. The percentage of cells is indicated in each quadrant. FSC, forward scatter. (B) Percentage of CD4+CD25+ cells in HD-PBLs, HCV-PBLs, and HCV-IHLs. (CE) Percentage of CD4+CD25+Foxp3+ cells (C), MFI of Foxp3+ cells in CD4+CD25+ cells (D), and relative percentage of Foxp3+ cells in CD4+CD25+ cells (E) from HD-PBLs, HCV-PBLs, and HCV-IHLs. In BE, statistical analyses of values between HCV-IHLs and HCV-PBLs were performed with the nonparametric Mann-Whitney U test for paired data, whereas those between cell populations from HCV patients and HDs were performed with the nonparametric Mann-Whitney U test for unpaired data.*P < 0.05; **P < 0.009; ***P < 0.0015. Each symbol represents a single individual.
Figure 2
Figure 2. Degree of difference in IL-2 production and proliferation between Tregs and Teffs in the site of infection.
(A) Representative flow cytometry analysis of HCV-PBLs or HCV-IHLs stained with mAbs to CD4, CD25, and Foxp3, stimulated or not with anti-CD3/CD28, and processed to detect intracellular IL-2. Contour plot analyses are gated on CD4+CD25+ cells and show percentages of double-stained IL-2+Foxp3+ cells. The percentage of cells is indicated in each quadrant. (B) Percentage of IL-2+ cells (analyzed by flow cytometry as in A) in peripheral or intrahepatic cell populations. Values subtracted the background are shown. (C) Representative flow cytometry analysis of HCV-PBLs or HCV-IHLs stained with mAbs to CD4, CD25, Foxp3, and Ki67. Contour plot analyses are gated on CD4+CD25+ cells and show cells stained with mAbs to Ki67 and Foxp3. The percentage of cells is indicated in each quadrant. (D) Percentage of Ki67+ cells (analyzed by flow cytometry as in C) in peripheral or intrahepatic cell populations. In B and D, statistical analyses of values between HCV-IHLs and HCV-PBLs were performed with the nonparametric Mann-Whitney U test for paired data, whereas those between cell populations from HCV patients and HDs were performed with the nonparametric Mann-Whitney U test for unpaired data. *P < 0.05; **P < 0.0065; ***P < 0.0015. Each symbol represents a single individual.
Figure 3
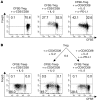
Figure 3. Intrahepatic Foxp3+ Tregs are related to suppression function and disease progression.
(A) Representative analysis of highly purified CD4+CD25 or CD4+CD25+ HCV-PBLs or HCV-IHLs stained with mAbs to CD4, CD25, and Foxp3. Numbers represent the percentage of stained cells. (B) Single representative suppression function experiment of 6, in which CFSE-labeled Tresps from an HCV patient were cultured alone or cocultured with CD4+CD25+ Tregs previously purified from pooled HCV-IHLs derived from liver biopsies of 4 patients. Cells were cultured or cocultured either in the same well or in separated transwell plate system (denoted by line) in the presence of anti-CD3/CD28. After 6 d, cells were stained with labeled mAbs to CD4, CD25, and Foxp3. The percentage of cells is indicated in each quadrant. (C) Correlation between suppression function, calculated as percent of suppression by 6 pools of Tregs isolated from 3–4 independent liver biopsies of a total of 16 HCV patients, and mean percentage of Foxp3+ cells in the corresponding intrahepatic (IH) CD4+CD25+ cells. (D and E) Correlation between percentage of intrahepatic Foxp3+ cells and of Ki67+ cells in intrahepatic Teffs (D) and Tregs (E). (F and G) Correlation between percentage of intrahepatic Foxp3+ cells and viral load (F) or HAI (G). In CG, statistical analyses were performed using Pearson’s correlation test. Each symbol represents 1 pool of intrahepatic Tregs from 3–4 patients (C) or a single individual (DG).
Figure 4
Figure 4. PD-1 upregulation on Tregs contrabalances the Foxp3 correlation with the disease progression.
(A) Representative flow cytometry analyses of HD-PBLs, HCV-PBLs, and HCV-IHLs stained with mAbs to CD4, CD25, Foxp3, and PD-1. Contour plot analyses are gated on CD4+CD25+ or CD4+CD25 cells, and percentages of Foxp3+ and/or PD-1+ cells are shown in each quadrant. (B and C) Percentage (B) and MFI (C) of PD-1+ cells in cell populations derived from HCV-PBLs or HCV-IHLs. Statistical analyses of values between HCV-IHLs and HCV-PBLs were performed with the nonparametric Mann-Whitney U test for paired data, whereas those between cell populations from HCV patients and HDs were performed with the nonparametric Mann-Whitney U test for unpaired data. *P < 0.03; **P < 0.0075; ***P < 0.0001. (D and E) Correlation between PD-1/Foxp3 cell ratio in IHLs and viral load (D) or HAI (E). Statistical analyses were performed using Pearson’s correlation test. Each symbol represents a single individual.
Figure 5
Figure 5. PD-L1 blockade enhances proliferation of HCV-specific Teffs.
(A) Representative experiment in which CFSE-labeled Tresps from an HCV patient were stimulated with APCs alone or HCV-Ags/APCs, in the presence or absence (isotype control) of anti–PD-L1 mAb. After 6 d, cells were stained with mAbs to CD4, CD25, and Foxp3. Dot plot analyses are gated on CD4+CD25 cells and show cells stained with both CFSE and anti-Foxp3. The percentage of cells is indicated in each quadrant. (B) All experiments (of which a representative is shown in A) showing the percentage of CFSE-labeled Tresps upon antigen stimulation in the presence or absence of anti–PD-L1. Statistical analyses were performed with nonparametric Mann-Whitney U-test for paired data. ***P < 0.0008. Each symbol represents a single individual.
Figure 6
Figure 6. PD-L1 blockade enhances IL-2–dependent proliferation of HCV-specific Tregs.
(A) Single representative of 5 experiments, in which purified CFSE-labeled CD4+CD25+ Tregs from an HCV patient were stimulated with APCs alone or HCV-Ags/APCs and cocultured in a transwell plate system (denoted by lines) with Tresps that were stimulated or not with anti-CD3/CD28 in the presence or absence of anti–IL-2 mAb. In some cocultures, anti–HLA class I or –HLA class II mAb was added to the wells containing antigen-stimulated Tregs. After 6 d, cells were stained with mAbs to CD4, CD25, and Foxp3. Dot plot analyses are gated on CD4+CD25+ cells and show cells stained with both CFSE and anti-Foxp3. The percentage of cells is indicated in each quadrant. (B) Single representative of all the experiments shown in C, in which CFSE-labeled Tregs from an HCV patient were stimulated with APCs alone or HCV-Ags/APCs in the presence or absence (isotype control) of anti–PD-L1 mAb and/or Tresps. After 6 d, cells were stained with mAbs to CD4, CD25, and Foxp3. Dot plot analyses are gated on CD4+CD25+ cells and show cells stained with both CFSE and anti-Foxp3. The percentage of cells is indicated in each quadrant. (C) Percentage of CFSE-labeled Foxp3+ cells in Tregs upon antigen stimulation in the presence or absence of anti–PD-L1 and/or Tresps. Statistical analyses were performed with nonparametric Mann-Whitney U test for paired data. **P < 0.0040. Each symbol represents a single individual.
Figure 7
Figure 7. Improved suppression function by PD-L1 blockade is related to Treg expansion.
(A) Single representative of 4 experiments in which CFSE-labeled CD4+CD25+ Tregs were stimulated with anti-CD3/CD28 in the presence or absence of IL-2 (50 U/ml) or anti–PD-L1. After 6 d, cells were stained with mAbs to CD4, CD25, and Foxp3. Dot plot analyses are gated on CD4+CD25+ cells and show cells stained with both CFSE and anti-Foxp3. The percentage of cells is indicated in each quadrant. (B) Single representative of 3 experiments in which CFSE-labeled Tresps were stimulated with anti-CD3/CD28 and 50 U/ml IL-2, alone or in coculture (at a 1:1 cell ratio) with Tregs that had previously stimulated for 6 d with anti-CD3/CD28 and 50 U/ml IL-2 or with anti-CD3/CD28, IL-2, and anti–PD-L1. After 6 d, cells were stained with mAbs to CD4, CD25, and Foxp3. Dot plot analyses are gated on CD4+CD25 cells and show cells stained with both CFSE and anti-Foxp3. The percentage of cells is indicated in each quadrant.
Figure 8
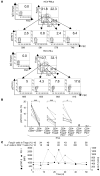
Figure 8. Tregs overexpress pSTAT-5 and PD-1 in a parallel fashion in steady states, but in an alternate fashion during the course of hepatitis reactivation.
(A) Representative flow cytometry analyses of fresh HCV-PBLs or HCV-IHLs stained with mAbs to CD4, CD25, Foxp3, and PD-1 and (at the intracytoplasmic level) with the polyclonal rabbit anti–pSTAT-5, followed by secondary FITC-conjugated goat anti-rabbit antibody. Contour plot analyses (upper histograms) are gated on CD4+CD25+ cells and show percentages of cells stained with mAbs to PD-1 and Foxp3, whereas analyses in the lower histograms are gated in cells stained with mAbs to PD-1 and Foxp3 and show pSTAT-5+ cells. The counter plot analyses of samples stained with the isotype control of anti–pSTAT-5 are shown above. The percentage of cells is indicated in each quadrant. pSTAT-5 MFI values are shown below the flow cytometry analyses. (B) Percentage of intrahepatic pSTAT-5+ cells in the indicated cell populations. Statistical analyses were performed with the nonparametric Mann-Whitney U test for paired data. *P < 0.025; ***P < 0.0006. Each symbol represents the value for a single individual. (C) Kinetics of pSTAT-5 and PD-1 expression in Tregs (expressed as MFI) in relation to the values of alanine aminotransferase (ALT; normal value, 0–40 IU/ml), percentage of Foxp3+ cells in Tregs, and percentage of IL-2+ cells in CD4+ Teffs, in a representative of 2 patients showing a severe hepatitis reactivation. Similar results were obtained in the second patient.
Figure 9
Figure 9. Improvement of pSTAT-5 upregulation in PD-1+ Tregs by PD-L1 blockade ex vivo.
(A) Single representative flow cytometry experiment of 6, in which HCV-IHLs were stimulated for 6 h with anti-CD3/CD28 and 50 U/ml IL-2 in the presence or absence of anti–PD-L1. Cells were then stained with the antibodies to the indicated molecules. Contour plot analyses are gated as indicated and show percentages of pSTAT-5+ cells. Counter plot analyses of samples stained with isotype control of anti–pSTAT-5 are shown above. The percentage of cells is indicated in each quadrant. pSTAT-5 MFI values are shown below the flow cytometry analyses. (B) Single representative flow cytometry experiment of 3, in which CD4+CD25+PD-1+ cells sorted from PBLs were stimulated or not for 6 h with anti-CD3/CD28 and 100 U/ml IL-2 in the presence or absence of anti–PD-L1. Cells were then stained with the antibodies to the indicated molecules. Contour plot analyses are gated on CD4+CD25+PD-1+ cells and show percentages of PD-1+pSTAT-5+ or Foxp3+pSTAT-5+ cells. The percentage of cells is indicated in each quadrant. pSTAT-5 MFI values are shown below the flow cytometry analyses.

Comment in

References

    1. Sakaguchi S., Sakaguchi N., Asano M., Itoh M., Toda M. Immunologic self-tolerance maintained by activated T cells expressing IL-2 receptor alpha-chains (CD25). Breakdown of a single mechanism of self-tolerance causes various autoimmune diseases. J. Immunol. 1995;155:1151–1164. - PubMed
    1. Takahashi T., et al. Immunologic self-tolerance maintained by CD25+CD4+ naturally anergic and suppressive T cells: induction of autoimmune disease by breaking their anergic/suppressive state. Int. Immunol. 1998;10:1969–1980. doi: 10.1093/intimm/10.12.1969. - DOI - PubMed
    1. Baecher-Allan C., Brown J.A., Freeman G.J., Hafler D.A. CD4+CD25high regulatory cells in human peripheral blood. J. Immunol. 2001;167:1245–1253. - PubMed
    1. Fontenot J.D., Gavin M.A., Rudensky A.Y. Foxp3 programs the development and function of CD4+CD25+ regulatory T cells. Nat. Immunol. 2003;4:330–336. doi: 10.1038/ni904. - DOI - PubMed
    1. Hori S., Nomura T., Sakaguchi S. Control of regulatory T cell development by the transcription factor Foxp3. Science. 2003;299:1057–1061. doi: 10.1126/science.1079490. - DOI - PubMed

Publication types

MeSH terms