. 2009 Apr 8;28(7):980-91.
doi: 10.1038/emboj.2009.41. Epub 2009 Feb 19.

Structural basis for HIV-1 DNA integration in the human genome, role of the LEDGF/P75 cofactor

Affiliations

Structural basis for HIV-1 DNA integration in the human genome, role of the LEDGF/P75 cofactor

Fabrice Michel et al. EMBO J. .

Abstract

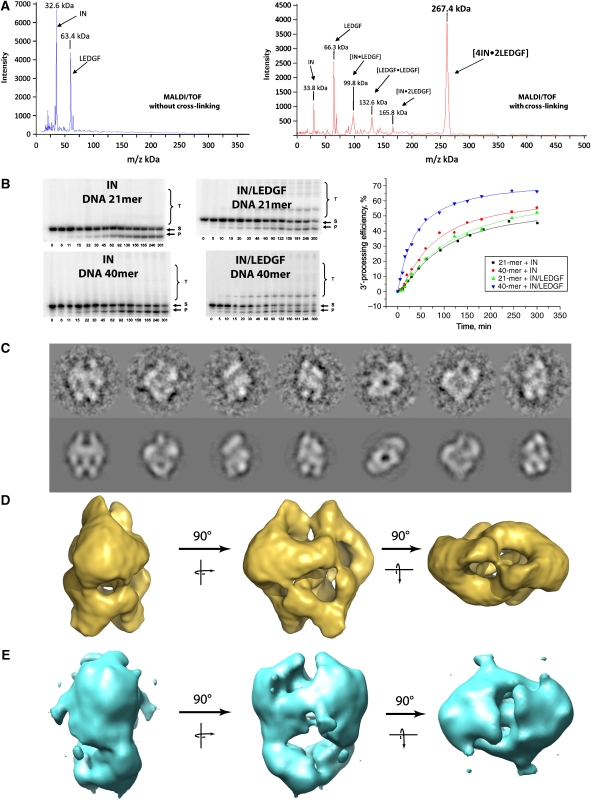
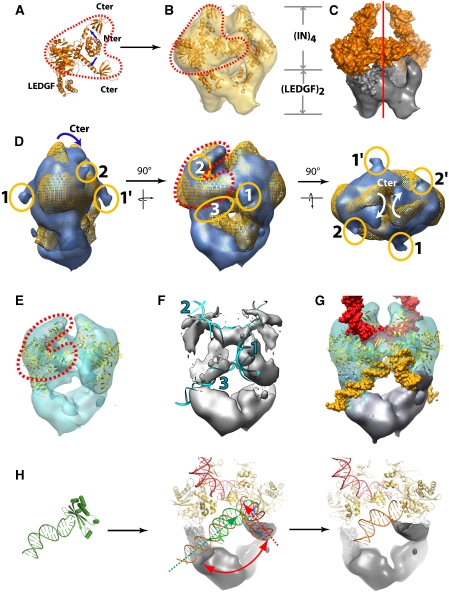
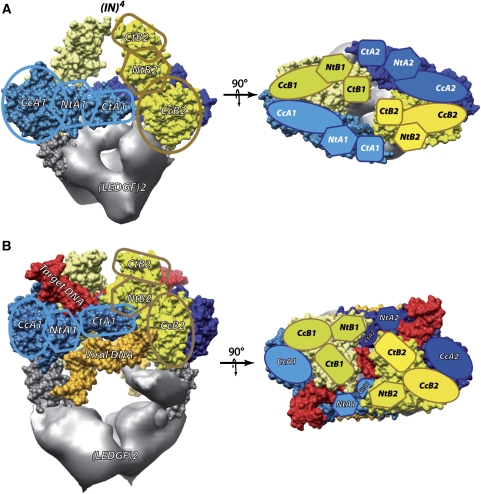
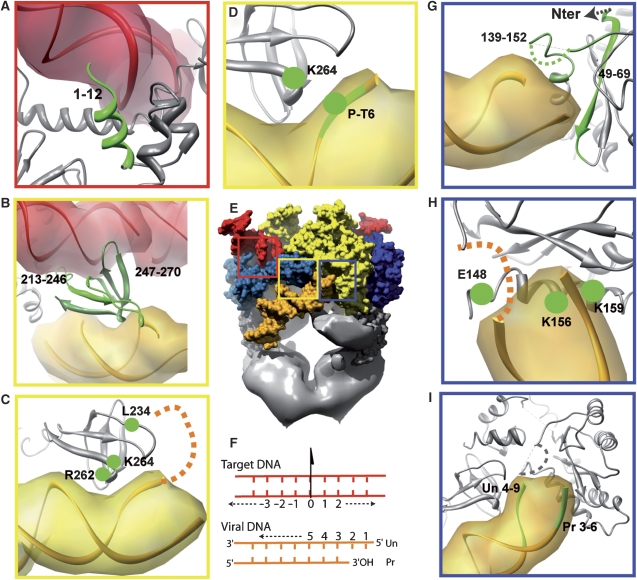
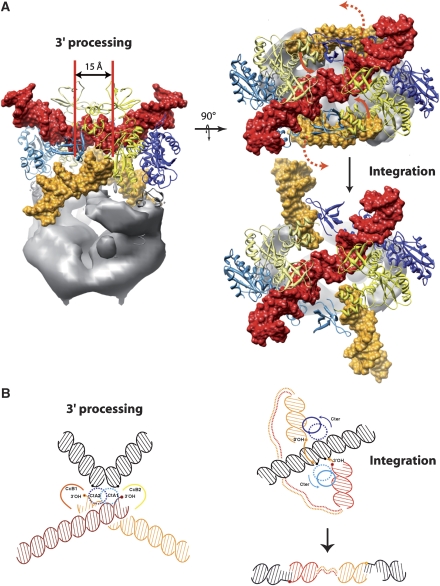
Integration of the human immunodeficiency virus (HIV-1) cDNA into the human genome is catalysed by integrase. Several studies have shown the importance of the interaction of cellular cofactors with integrase for viral integration and infectivity. In this study, we produced a stable and functional complex between the wild-type full-length integrase (IN) and the cellular cofactor LEDGF/p75 that shows enhanced in vitro integration activity compared with the integrase alone. Mass spectrometry analysis and the fitting of known atomic structures in cryo negatively stain electron microscopy (EM) maps revealed that the functional unit comprises two asymmetric integrase dimers and two LEDGF/p75 molecules. In the presence of DNA, EM revealed the DNA-binding sites and indicated that, in each asymmetric dimer, one integrase molecule performs the catalytic reaction, whereas the other one positions the viral DNA in the active site of the opposite dimer. The positions of the target and viral DNAs for the 3' processing and integration reaction shed light on the integration mechanism, a process with wide implications for the understanding of viral-induced pathologies.


Figures

Figure 1
Figure 1
Functional characterisation and structure determination of the IN/LEDGF complexes. (A) IN/LEDGF complex analysis by high-mass MALDI mass spectrometry in the absence and presence of cross-linking agent showing a major peak of (IN)4–(LEDGF)2. (B) Kinetic study of the 3′ processing and strand-transfer reactions catalysed by HIV-1 integrase or by the IN–LEDGF complex using a 21- or 40-mer DNA substrate. Bands correspond to substrate DNA (S), 3′-processed product (P) and strand-transfer product (T). Incubation times are in min. The bands intensities are reported as a function of time, showing the increase of the 3′ processing kinetic when using the IN–LEDGF complex with a 40-mer DNA substrate. (C) Views of the cryo negatively stained IN/LEDGF complex (upper row) and the corresponding reprojections of the 3-D model (lower row). (D) The 3-D model of the cryo negatively stained IN/LEDGF complex. (E) The 3-D model of the cryo negatively stained IN/LEDGF complex in the presence of the 21-bp DNA substrate.
Figure 2
Figure 2
Docking of atomic structures into the cryoEM maps of IN/LEDGF and IN/LEDGF/DNA. (A) Composite atomic model constructed from available X-ray structures. (B) Superposition of the fitted 3-D model and the IN/LEDGF EM envelope. The Y-shaped structure that accommodates the atomic structure of the catalytic and C-terminal IN domains is contoured by red dots. (C) Surface representation of the IN/LEDGF structure: the IN tetramer is in gold and the LEDGF dimer visualised by the difference map between the atomic model and the EM map is in grey. (D) Superposition of the IN/LEDGF (gold) and IN/LEDGF/DNA (blue) envelopes. The Y-shape in the top of the envelope is highlighted with red dots. The protruding densities corresponding to DNA are circled in orange. Densities (1) and (3) are assigned to viral DNA, whereas density (2) is assigned to target DNA. (E) Atomic model fitted into the IN/LEDGF/DNA envelope. (F) Difference map between the EM map and the fitted model. Fitted DNA is shown in blue. 1 and 3 represent the viral DNA, respectively, in the integration and 3′-processing step, and 2 represents the target DNA. (G) Atomic models of IN and DNA fitted into the EM map. DNA molecules assigned to viral DNA are shown in yellow and DNA assigned to target DNA is shown in red. (H) Crystal structure of the Tn5–DNA complex superposed to the IN–CCD identifying the viral DNA in the 3′-processing position. Two viral DNA positions in the integration intermediate and 3′-processing state are represented by red and green arrows, respectively. IN is indicated in gold, the viral DNA in orange, the target DNA in red and the envelope for the LEDGF dimer in grey.
Figure 3
Figure 3
Integrase domain organisation. (A) Two perpendicular views of the (IN)4–(LEGDF)2 complex. Each IN/LEDGF complex contains 4 IN molecules (A1, A2, B1 and B2) organised in two IN dimers (1 and 2). The different IN monomers are represented with different colours: monomer A1 in light blue, A2 in dark blue, B1 in light yellow and B2 in yellow. Monomers 1 and 2 are related by a two-fold axis. The density of LEDGF (grey) is obtained by subtracting the model from the EM map. (B) Same views for the complex with DNA in the 3′-processing state. The viral DNA is shown in orange and the target DNA in red.
Figure 4
Figure 4
Consistency of the proposed model with published experimental protein–DNA interactions data. The nucleotides or amino acids that have been shown to interact by biochemical or mutational experiments are shown in green. (A) N-terminal domain of monomer A1 interacting with target DNA (red). (BD) The C-terminal domain of monomer A1 is interacting with the target DNA (red) and viral DNA (orange). (E) Full complex: the squares represent the position of the magnified views. (F) Nucleotide numbering used in this publication. Un represents the unprocessed and Pr represents the processed strand of the viral DNA. The target DNA numbering start at 0, which is placed at the pseudo two-fold axis relating the two IN monomers. (GI) Interactions of the viral DNA with the catalytic core of IN.
Figure 5
Figure 5
Model for DNA integration. (A) The distance of 15 Å (5 bp) corresponds to the integration distance of the viral DNA (yellow) in the target DNA (red). The red arrows represent the movement of the viral DNA towards the integration intermediate structure. (B) Sketch showing the relative positions of the DNA molecules for the 3′ processing and integration reactions (the target DNA is in black and the viral DNA in orange and red). The integration reaction, which takes place through a nucleophilic attack by the 3′OH end on a 5′ phosphate of the target DNA, requires the displacement of the integrase C-terminus together with the viral DNA.

Similar articles

Cited by

References

    1. Agapkina J, Smolov M, Barbe S, Zubin E, Zatsepin T, Deprez E, Le BM, Mouscadet JF, Gottikh M (2006) Probing of HIV-1 integrase/DNA interactions using novel analogs of viral DNA. J Biol Chem 281: 11530–11540 - PubMed
    1. Busschots K, Voet A, De MM, Rain JC, Emiliani S, Benarous R, Desender L, Debyser Z, Christ F (2007) Identification of the LEDGF/p75 binding site in HIV-1 integrase. J Mol Biol 365: 1480–1492 - PubMed
    1. Chen JC, Krucinski J, Miercke LJ, Finer-Moore JS, Tang AH, Leavitt AD, Stroud RM (2000) Crystal structure of the HIV-1 integrase catalytic core and C-terminal domains: a model for viral DNA binding. Proc Natl Acad Sci USA 97: 8233–8238 - PMC - PubMed
    1. Cherepanov P (2007) LEDGF/p75 interacts with divergent lentiviral integrases and modulates their enzymatic activity in vitro. Nucleic Acids Res 35: 113–124 - PMC - PubMed
    1. Cherepanov P, Ambrosio AL, Rahman S, Ellenberger T, Engelman A (2005) Structural basis for the recognition between HIV-1 integrase and transcriptional coactivator p75. Proc Natl Acad Sci USA 102: 17308–17313 - PMC - PubMed

Publication types

Substances