. 2009 Apr 8;28(7):889-901.
doi: 10.1038/emboj.2009.29. Epub 2009 Feb 19.

Protein quality control during aging involves recruitment of the macroautophagy pathway by BAG3

Affiliations

Protein quality control during aging involves recruitment of the macroautophagy pathway by BAG3

Martin Gamerdinger et al. EMBO J. .

Abstract

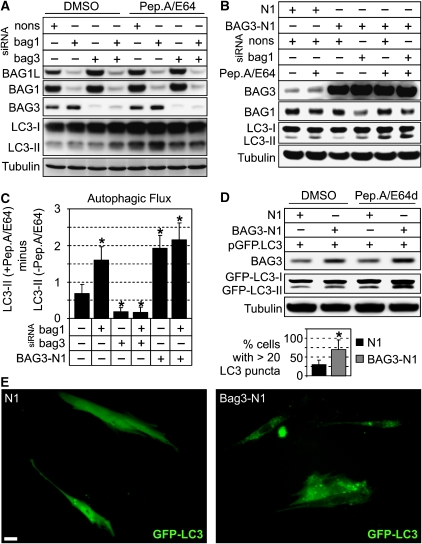
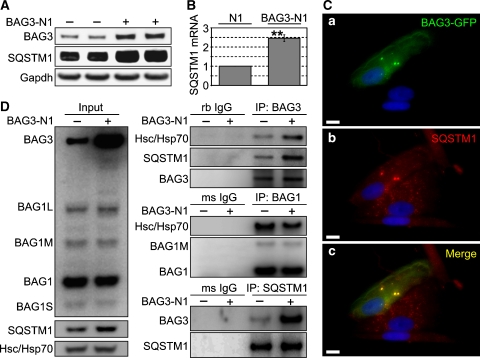
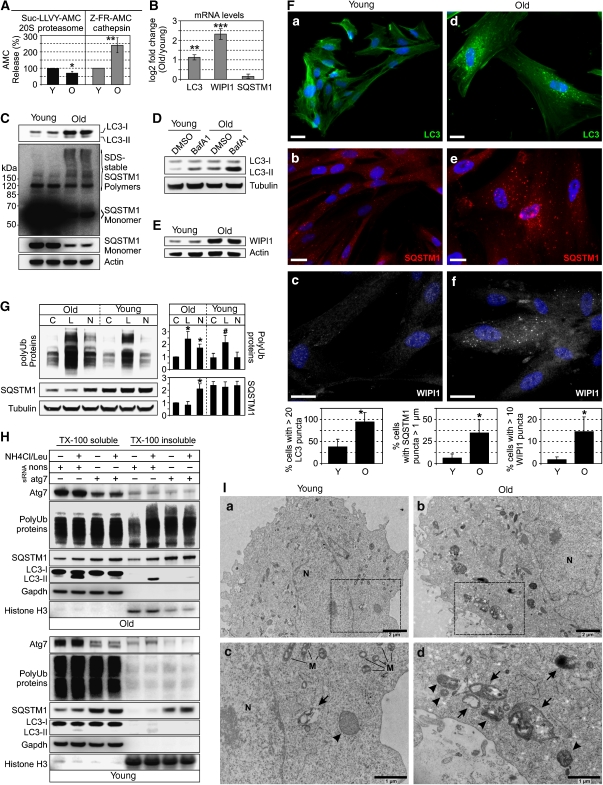
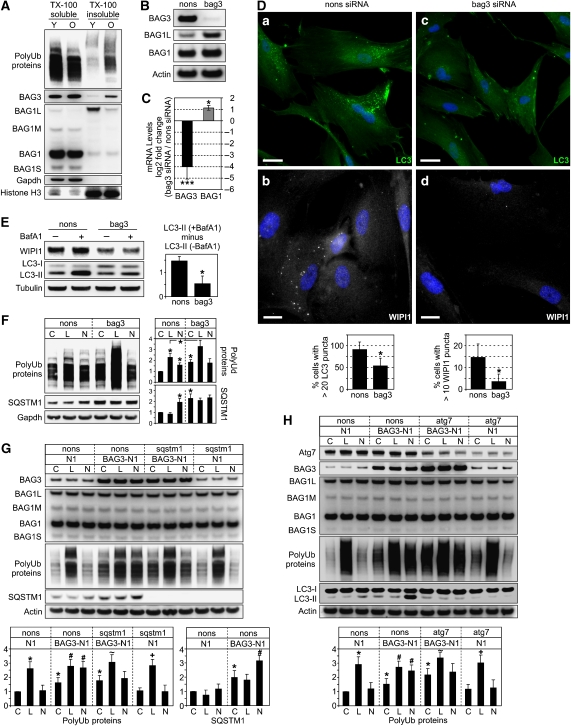
The Hsc/Hsp70 co-chaperones of the BAG (Bcl-2-associated athanogene) protein family are modulators of protein quality control. We examined the specific roles of BAG1 and BAG3 in protein degradation during the aging process. We show that BAG1 and BAG3 regulate proteasomal and macroautophagic pathways, respectively, for the degradation of polyubiquitinated proteins. Moreover, using models of cellular aging, we find that a switch from BAG1 to BAG3 determines that aged cells use more intensively the macroautophagic system for turnover of polyubiquitinated proteins. This increased macroautophagic flux is regulated by BAG3 in concert with the ubiquitin-binding protein p62/SQSTM1. The BAG3/BAG1 ratio is also elevated in neurons during aging of the rodent brain, where, consistent with a higher macroautophagy activity, we find increased levels of the autophagosomal marker LC3-II as well as a higher cathepsin activity. We conclude that the BAG3-mediated recruitment of the macroautophagy pathway is an important adaptation of the protein quality control system to maintain protein homeostasis in the presence of an enhanced pro-oxidant and aggregation-prone milieu characteristic of aging.


Figures

Figure 1
Figure 1
(A) Immunoblot analysis of BAG1, BAG3, Hsc/Hsp70 and Hsp90 in young and old I90 cells. For detection of BAG proteins, an antibody directed against the conserved BAG domain was used. (B) Real-time PCR analysis of human BAG family members and Hsc70 and Hsp90 in young and old I90 cells. Depicted is the expression ratio (log2) of target genes in old cells relative to young cells. *P<0.05 and **P<0.01 versus young, n=3. (C) Co-IP analysis of Hsc/Hsp70 interaction with BAG1 and BAG3 in young (Y) and old (O) I90 cells. Upper panel shows relative amounts of proteins in cell lysates used for Co-IP (Input). Middle panel shows levels of BAG1 and BAG3 found in Hsc/Hsp70 immunoprecipitates. Lower panel shows levels of Hsc/Hsp70 co-sedimented upon immunoprecipitation of BAG3. (D, E) 293 cells were treated with the indicated agents for 8 h followed by immunoblot analysis of indicated proteins.
Figure 2
Figure 2
(A) 293 cells were transfected with bag1, bag3 or nonsense (nons) siRNAs, as indicated. After 48 h, cells were transfected with d2GFP expression plasmid together with half the amounts of the indicated siRNAs. After additional 24 h, levels of indicated proteins were detected by immunoblot analysis. (B) 293 cells were transfected with indicated siRNAs for 48 h followed by real-time PCR analysis of BAG1 and BAG3 mRNA levels. Depicted is the mean relative expression ratio (log2) ±s.e.m. *P<0.05 and ***P<0.001 versus nons, n=3. (C) BAG1 knockdown was performed in 293 cells for 48 h. Thereafter, cells were transfected with GFP or GFP-based UPS reporter genes as indicated. After additional 24 h, levels of GFP-positive proteins were detected by western-blot analysis using a GFP antibody. (D, E) Immunoblot analysis of indicated proteins from d2HEK cells treated with different concentrations of MG132 for 5 h (D) or transfected with indicated amounts of BAG1S plasmid for 24 h (E).
Figure 3
Figure 3
(A) 293 cells were transfected with nonsense (nons), bag1 or bag3 siRNAs for 48 h and then treated for 2 h with the lysosomal inhibitors pepstatinA and E64 (both 10 μg/ml; Pep.A/E64) or DMSO as control, followed by immunoblot analysis of the indicated proteins. (B) 293 cells were transfected for 48 h with the indicated siRNAs and BAG3 expression plasmid (BAG3-N1) or vector control (N1) followed by the same analysis as in (A). (C) Diagram shows the autophagic flux of 293 cells with differently modulated BAG1 and BAG3 levels as described in (A) and (B). Autophagic flux was determined by the strength of LC3-II accumulation in a 2-h treatment period with Pep.A/E64. Therefore, normalised LC3-II levels in the absence of inhibitors were subtracted from corresponding levels obtained in the presence of Pep.A/E64. Values are expressed as mean±s.e.m. *P<0.05 versus control-transfected cells, n=3. (D) I90 cells were transfected with GFP fused to LC3 (pGFP.LC3) and co-transfected either with BAG3-N1 or N1. After transfection for 48 h, cells were treated as in (A) and levels of indicated proteins were detected by immunoblot analysis. (E) I90 cells, transfected as in (D) for 24 h, were microscopically analysed for GFP-LC3 fluorescence. Representative pictures are shown. Bar: 20 μm. Values expressed in diagram are mean±s.e.m. from three independent experiments (50 cells were counted per experiment). *P<0.05 versus N1, n=3.
Figure 4
Figure 4
(A) I90 cells were transfected with BAG3 (BAG3-N1) or vector control. After transfection for 48 h, levels of indicated proteins were detected by western-blot analysis. (B) Transcript levels of SQSTM1 in I90 cells transfected as in (A) were compared by real-time PCR analysis. Depicted is the fold-increase of SQSTM1 mRNA levels in BAG3-N1-transfected cells relative to control (N1)-transfected cells. Values are expressed as mean±s.e.m. **P<0.01 versus N1 cells, n=3. (C) I90 cells were transfected with a BAG3-GFP fusion plasmid for 48 h followed by indirect immunofluorescence staining of endogenous SQSTM1. (a) Direct fluorescence of BAG3-GFP (green), (b) indirect immunofluorescence of SQSTM1 (red) and (c) the stainings of (a) and (b) overlapped. DAPI (blue) was used to stain DNA. Representative pictures are shown. Bar: 10 μm. (D) Co-IP studies testing the interaction of SQSTM1 and BAG3. I90 cells were transfected as in (A). After 24 h, SQSTM1 and BAG3 were immunoprecipitated followed by analysis of co-sedimented proteins, as indicated. As negative control purified rabbit (rb) and mouse (ms) IgG was used. Left panel shows relative amounts of proteins in lysates used for Co-IP (Input).
Figure 5
Figure 5
(A) Proteasomal chymotrypsin and cathepsin activity in lysates from young (Y) and old (O) I90 cells was determined using specific fluorescence probes, as described in the Material and methods section. Values are expressed are mean±s.e.m. *P<0.05 and **P<0.01 versus young, n=3. (B) Real-time PCR analysis of LC3, WIPI1 and SQSTM1 mRNA levels in young and old I90 cells. Depicted is the mean expression ratio (log2) ±s.e.m. of target genes in old cells relative to young cells. **P<0.01 and ***P<0.001 versus young, n=3. (C) Immunoblot analysis of LC3 and SQSTM1 in young and old I90 cells. (D) Young and old I90 cells were treated for 2 h with bafilomycin A1 (BafA1, 2 μM) or DMSO as control followed by immunoblot analysis of indicated proteins. (E) Immunoblot analysis of WIPI1 expression in young and old I90 cells. (F) Indirect immunofluorescence staining of endogenous LC3 (green), SQSTM1 (red) and WIPI1 (white) in I90 cells of young and old age. DAPI (blue) was used to stain DNA. Representative pictures are shown. Bar: 20 μm. Diagrams show percentage of cells with indicated characteristics counted as in Figure 3E. (G) Old and young I90 cells were treated for 1 h with DMSO as control (C), lactacystin (L, 2 μM) or NH4Cl (20 mM) plus leupeptin (Leu, 5 μM) (N, NH4Cl/Leu). Western-blot analyses were performed for detection of indicated proteins. In the diagram (right panel), levels of polyUb-proteins and SQSTM1 are depicted after normalisation to corresponding Tubulin levels. Values are expressed as mean±s.e.m. *P<0.05 versus old control, #P<0.05 versus young control, n=3. (H) I90 cells of old (upper panel) and young (lower panel) age were transfected with atg7 or nonsense (nons) siRNA. After transfection for 4 days , the cells were treated with NH4Cl/Leu or DMSO for 1 h followed by fractioning of cell lysates in TritonX-100 (TX-100) soluble and insoluble material. Equal protein amounts of both fractions were directed to immunoblot analysis for analysis of indicated proteins. Gapdh and Histone H3 were used as loading controls of soluble and insoluble fractions, respectively. (I) Transmission electron microscopic analysis of young (a) and old (b) I90 cells. Magnifications of marked areas in (a) and (b) are shown in (c) and (d), respectively. An arrow indicates an autolysosome, and arrow heads indicate autophagosomes. M, mitochondrion. N, nucleus.
Figure 6
Figure 6
(A) Immunoblot analysis of indicated proteins of young (Y) and old (O) I90 cells upon fractionation as described in Figure 5H. (B, C) After transfection for 96 h of old I90 cells with bag3 or nonsense (nons) siRNA, BAG1 and BAG3 protein and mRNA levels were analysed by immunoblot (B) and real-time PCR (C) analysis, respectively. Transcript levels in bag3 siRNA cells are depicted as the mean log2 expression ratio ±s.e.m. relative to nons siRNA cells. *P<0.05 and ***P<0.001 versus nons, n=3. (D) Indirect immunofluorescence analysis of endogenous LC3 (green) and WIPI1 (white) in old I90 cells transfected with nons (a, b) and bag3 siRNA (c, d) for 96 h. DAPI (blue) was used as a nuclear marker. Representative pictures are shown. Bar: 20 μm. Diagrams show percentage of cells counted as in Figure 3E. (E) Same analysis as in Figure 5D but old cells transfected as in (A) were used. Values expressed in the diagram are mean±s.e.m. *P<0.05 versus nons, n=3. (F) Same analysis as in Figure 5G but old I90 cells transfected as in (A) were used. C, control; L, lactacystin, N, NH4Cl/Leu. Values are expressed as mean±s.e.m. *P<0.05 versus nons control, or as indicated, n=3. (G, H) Same analysis as in (F) but young I90 cells 48 h after transfection with a BAG3 expression plasmid (BAG3-N1) or vector control (N1) together with nons or sqstm1 siRNA (G) and nons or atg7 siRNA (H), as indicated, were used. *, #, ∼ and +, P<0.05 versus C N1, C BAG3-N1, C BAG3-N1 sqstm1 or atg7 and C N1 sqstm1 or atg7, n=3.
Figure 7
Figure 7
(A) Protein extracts from cerebellum (CER) of young (Y, 3 months) and old (O, 24 months) mice were analysed for BAG1 and BAG3 expression by immunoblot analysis. (B) Real-time PCR analysis of indicated mRNA levels in cerebellum of young and old mice. Depicted is the log2 expression ratio of target genes in old mice relative to young mice. Values are expressed as mean±s.e.m. *P<0.05 and **P<0.01 versus young, n=3. (C) Immunoblot analysis as in (A) but in cortex (CTX), hippocampus (HIP) and mid-brain (MB). (D) Western-blot analysis of indicated proteins in different brain regions of young and old mice. (E) Total cathepsin and specific cathepsin B activity in brain extracts from young and old mice was determined using fluorescence probes Z-FR-AMC and Z-RR-AMC, respectively, as described in the Material and methods section. Values are expressed as mean±s.e.m. *P<0.05 versus young, n=3. (F) Expression analysis of indicated proteins in primary hippocampal astrocytic and neuronal cell cultures from young (2 months) and old (24 months) rats. Detection of GLT1 and NeuN served as astrocyte and neuron markers, respectively. Note the NeuN signals in astrocytic cultures. We attributed these signals to the presence of resting nuclei of dead neurons, which we observed under the microscope.

References

    1. Arndt V, Daniel C, Nastainczyk W, Alberti S, Hohfeld J (2005) BAG-2 acts as an inhibitor of the chaperone-associated ubiquitin ligase CHIP. Mol Biol Cell 16: 5891–5900 - PMC - PubMed
    1. Balaban RS, Nemoto S, Finkel T (2005) Mitochondria, oxidants, and aging. Cell 120: 483–495 - PubMed
    1. Balch WE, Morimoto RI, Dillin A, Kelly JW (2008) Adapting proteostasis for disease intervention. Science 319: 916–919 - PubMed
    1. Bence NF, Sampat RM, Kopito RR (2001) Impairment of the ubiquitin-proteasome system by protein aggregation. Science 292: 1552–1555 - PubMed
    1. Bimston D, Song J, Winchester D, Takayama S, Reed JC, Morimoto RI (1998) BAG-1, a negative regulator of Hsp70 chaperone activity, uncouples nucleotide hydrolysis from substrate release. EMBO J 17: 6871–6878 - PMC - PubMed

Publication types

Substances