. 2009 Apr 8;28(7):877-88.
doi: 10.1038/emboj.2009.34. Epub 2009 Feb 19.

Active promoters and insulators are marked by the centrosomal protein 190

Affiliations

Active promoters and insulators are marked by the centrosomal protein 190

Marek Bartkuhn et al. EMBO J. .

Abstract

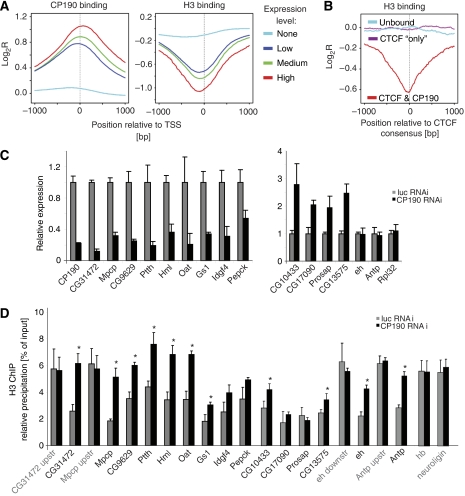
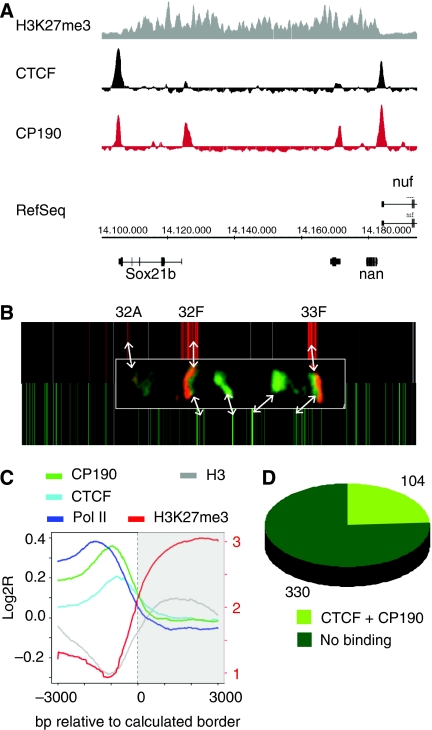
For the compact Drosophila genome, several factors mediating insulator function, such as su(Hw) and dCTCF, have been identified. Recent analyses showed that both these insulator-binding factors are functionally dependent on the same cofactor, CP190. Here we analysed genome-wide binding of CP190 and dCTCF. CP190 binding was detected at CTCF, su(Hw) and GAF sites and unexpectedly at the transcriptional start sites of actively transcribed genes. Both insulator and transcription start site CP190-binding elements are strictly marked by a depletion of histone H3 and, therefore, a loss of nucleosome occupancy. In addition, CP190/dCTCF double occupancy was seen at the borders of many H3K27me3 'islands'. As before, these sites were also depleted of H3. Loss of either dCTCF or CP190 causes an increase of H3 and H3K27 trimethylation at these sites. Thus, for both types of cis-regulatory elements, domain borders and promoters, the chromatin structure is dependent on CP190.


Figures

Figure 1
Figure 1
dCTCF- and CP190-binding sites in the genome. (A) Distribution of significantly bound tiles in comparison to genomic sequence classes. Gene proximal and non-coding tiles are significantly overrepresented for CTCF, CP190 and CTCF/CP190 (Fisher exact test: in all cases P<10−16). (B) Weblogo of the Drosophila CTCF-binding site consensus as determined by MEME motif search with the top 500 ChIP-chip regions in comparison to the human CTCF consensus (Kim et al, 2007). (C) Venn diagram of 3102 CTCF sites and 8862 CP190 sites (number of bound regions at 5% FDR). (D) Two thirds of the dCTCF sites (CTS) are bound by CP190 (heat map). Binding is shown within a 5-kb window sorted by binding strength (red) from top to bottom in each of the panels. Peak maxima of CTCF regions (left panel) and CP190 profiles sampled over the CTCF peak maxima (right panel).
Figure 2
Figure 2
CP190 colocalises with dCTCF, su(Hw), GAF, E(Z) and cohesin. (A) Genome browser view of the 14.2–15.2 Mb region of chromosome 2L. Log2 ratios of dCTCF and CP190 precipitation are compared with su(Hw) (Adryan et al, 2007), the cohesin component Stromalin (Misulovin et al, 2008) and GAF (Lee et al, 2008). (B) Venn diagram of all 63 su(Hw) sites within the 3-Mb Adh region (Adryan et al, 2007) and 45 dCTCF and 130 CP190 sites in this area. (C) Venn diagram of all 3102 dCTCF sites with CP190 and GAF (Lee et al, 2008). (D) Venn diagram of all 308 E(Z)-binding sites with all dCTCF and CP190 sites (Schwartz et al, 2006).
Figure 3
Figure 3
dCTCF and CP190 binding in dCTCF/CP190-dependent genes. Heat map presentation of CTCF (A) or CP190 (B) binding (red) within a 2-kb window of the 3′end (CTCF) and the TSS (both factors) of the top 19 dCTCF-dependent genes and the top 40 CP190-dependent genes as identified in microarray analysis of S2 cells after specific RNAi treatment. Horizontal rows represent individual genes with the fold expression change (fc) after specific knock-down indicated. (C) Most of the genes responding to CP190 or CTCF knock-down harbour binding sites for either factors within the gene region (transcribed region plus 1 kb flanking sequences; for details see Supplementary Tables I and II).
Figure 4
Figure 4
CP190 is associated with depletion of histone H3. (A) Genes were grouped by expression levels (Muse et al, 2007) into highly (red, 256 genes), medium (green, 1640 genes), low (dark blue, 1389 genes) and not expressed genes (light blue, 3673 genes) and cumulative binding profiles for CP190 and H3 (Larschan et al, 2007) relative to a 2-kb window at the TSS are shown as averaged mean enrichment ratios. (B) CP190 binds to CTS with a lack of H3. H3 profiles were sampled over a 2-kb window at the CTCF consensus for three data sets (200 sites each): CTCF plus CP190 binding (red), CTS devoid of CP190 (purple) and control CTCF consensus sites lacking both, CTCF and CP190 (blue). (C) Expression changes of individual genes after CP190-specific RNAi knock-down in Drosophila S2 cells result in upregulation (right panel) as well as downregulation (left panel). Firefly luciferase RNAi and genes Antp, eh and Rpl32 that showed no change in expression after loss of CP190 were used as controls. ChIP with anti-histone H3 antibody was analysed for promoters of downregulated genes (see above and Supplementary Table II) or for upregulated genes and for not affected genes (D). The genes hb and neuroligin are not bound by CP190 nor is their expression changed after RNAi. Error bars indicate the standard error of the mean of four independent experiments (*P<0.05 as calculated from a two-tailed t-test).
Figure 5
Figure 5
dCTCF and CP190 mark borders of H3K27 trimethylation. (A) Genome browser view of ChIP-chip results for H3K27me3 (Schwartz et al, 2006) compared with dCTCF and CP190 precipitation in the 14.1–14.2 Mb region of chromosome 3L. (B) Alignment of CP190 (green) and H3K27me3 (red) ChIP-chip data (heat map) with polytene antibody staining (insert) for CP190 (green) and H3K27me3 (red) within the cytological region 32A to 33F of chromosome 2L. (C) H3 is underrepresented at CP190- and dCTCF-binding sites at domain borders. Compiled log2 ratios of ChIP results at the 434 borders of H3K27me3-enriched domains (217 in total) positioned to the right (grey). Graphs of the ChIP results for CP190, dCTCF (this study), H3 (Larschan et al, 2007), Pol II (Misulovin et al, 2008) and H3K27me3 (Schwartz et al, 2006). (D) Diagram of all borders of H3K27me3 domains, indicating that 24% are double occupied by both CP190 and dCTCF.
Figure 6
Figure 6
CTCF and CP190 control chromatin structure at borders of H3K27me3 domains. Genome browser view (top) of H3K27me3 domain borders (Schwartz et al, 2006) in the vicinity of the genes CG4389, CG1354 CG13689 and sbr with the amplicons (filled boxes) ‘inside' (within shaded domain), at the CTS and ‘outside' of the H3K27me3 domain. These amplicons were used to detect binding of dCTCF, CP190, H3 and H3K27me3 in wild type (w), dCTCF deficient (p30.6) and CP190 loss of function mutant third instar larvae (Cp1901). Error bars indicate the standard error of the mean of at least three independent experiments (a statistical confidence of P<0.05 for changes in H3 and H3K27me3 precipitation is indicated by asterisks (calculated from a two-tailed t-test)). To compare H3 and H3K27me3 between the different strains, relative precipitation was calculated relative to four invariant sites >10 kb separated from any CTCF- or CP190-binding site.

References

    1. Adryan B, Woerfel G, Birch-Machin I, Gao S, Quick M, Meadows L, Russell S, White R (2007) Genomic mapping of suppressor of Hairy-wing binding sites in Drosophila. Genome Biol 8: R167. - PMC - PubMed
    1. Albert TK, Grote K, Boeing S, Stelzer G, Schepers A, Meisterernst M (2007) Global distribution of negative cofactor 2 subunit-alpha on human promoters. Proc Natl Acad Sci USA 104: 10000–10005 - PMC - PubMed
    1. Barrera L, Li Z, Smith AD, Arden KC, Cavenee WK, Zhang MQ, Green R, Ren B (2008) Genome-wide mapping and analysis of active promoters in mouse embryonic stem cells and adult organs. Genome Res 18: 46–59 - PMC - PubMed
    1. Barski A, Cuddapah S, Cui K, Roh T, Schones D, Wang Z, Wei G, Chepelev I, Zhao K (2007) High-resolution profiling of histone methylations in the human genome. Cell 129: 823–837 - PubMed
    1. Beisel C, Buness A, Roustan-Espinosa IM, Koch B, Schmitt S, Haas SA, Hild M, Katsuyama T, Paro R (2007) Comparing active and repressed expression states of genes controlled by the polycomb/trithorax group proteins. Proc Natl Acad Sci USA 104: 16615–16620 - PMC - PubMed

Publication types

MeSH terms