. 2009 Feb;5(2):e1000389.
doi: 10.1371/journal.pgen.1000389. Epub 2009 Feb 20.

Altered hematopoiesis in mice lacking DNA polymerase mu is due to inefficient double-strand break repair

Affiliations

Altered hematopoiesis in mice lacking DNA polymerase mu is due to inefficient double-strand break repair

Daniel Lucas et al. PLoS Genet. 2009 Feb.

Abstract

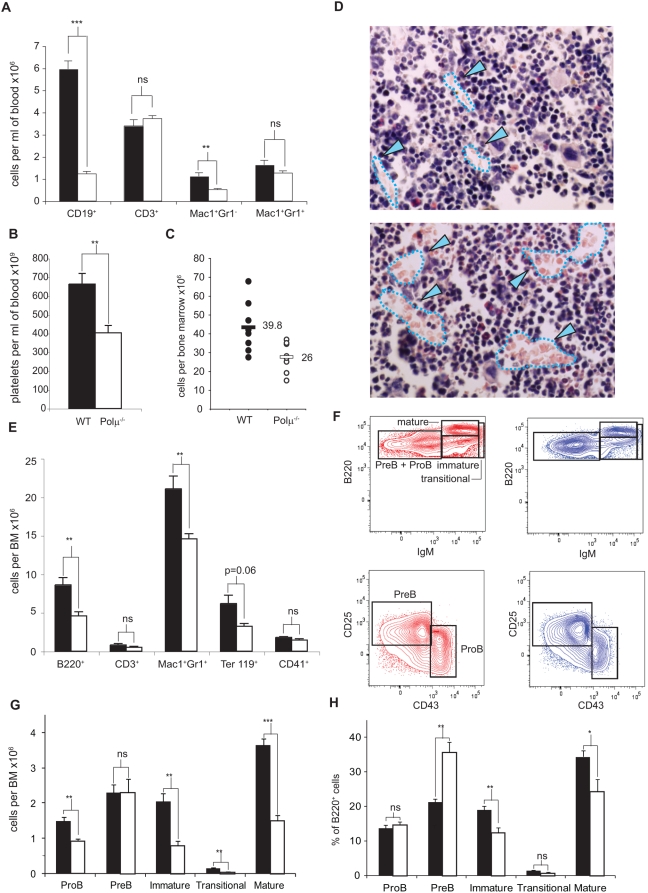
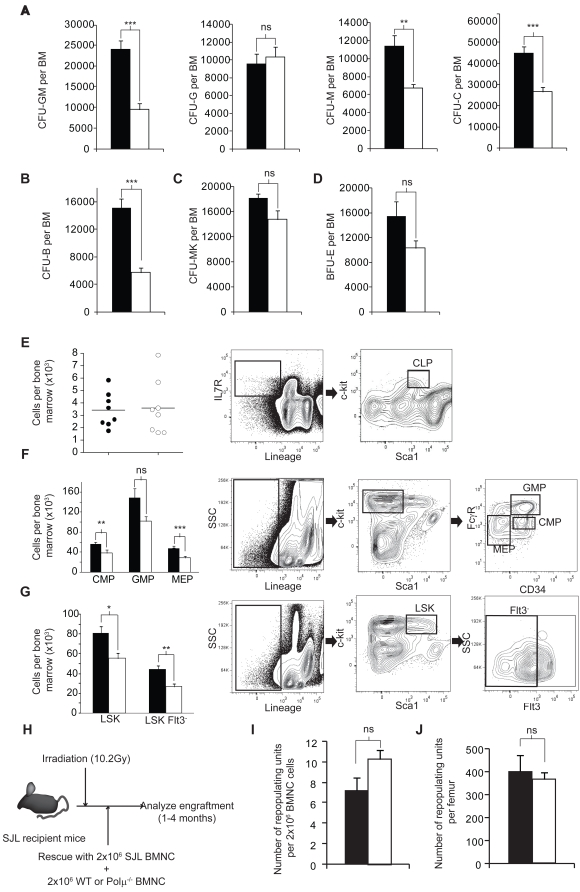
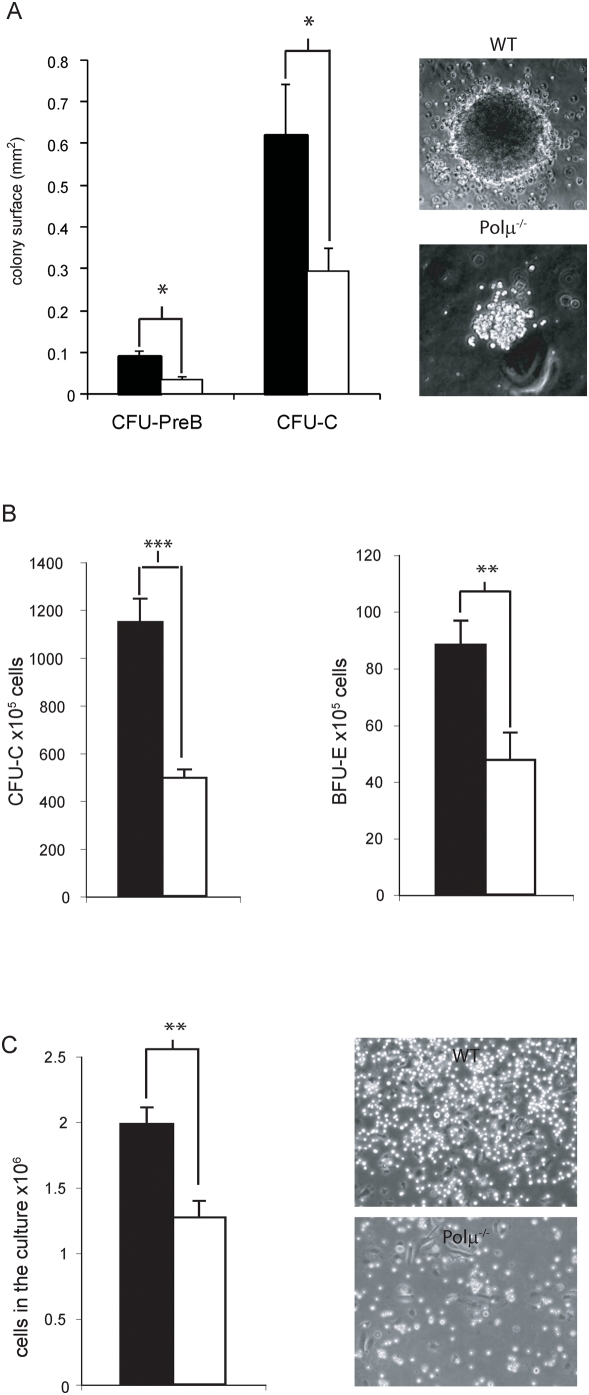
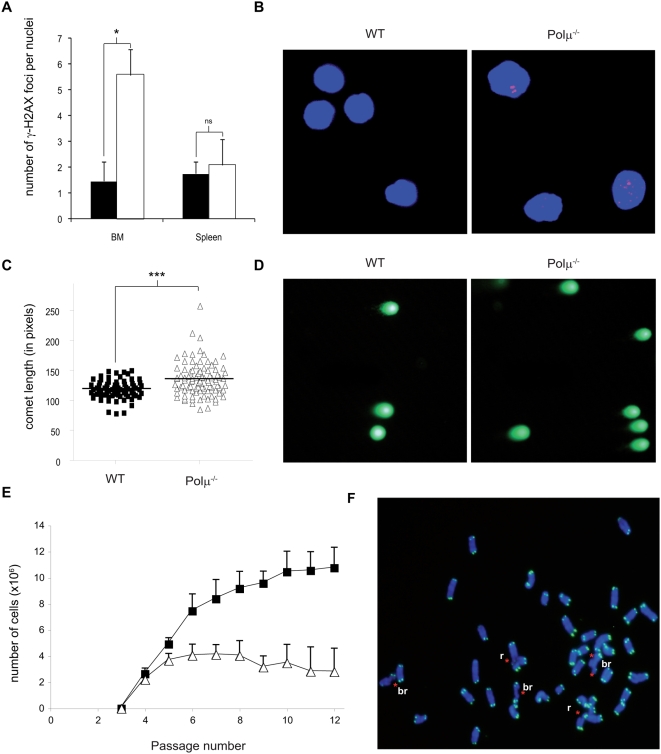
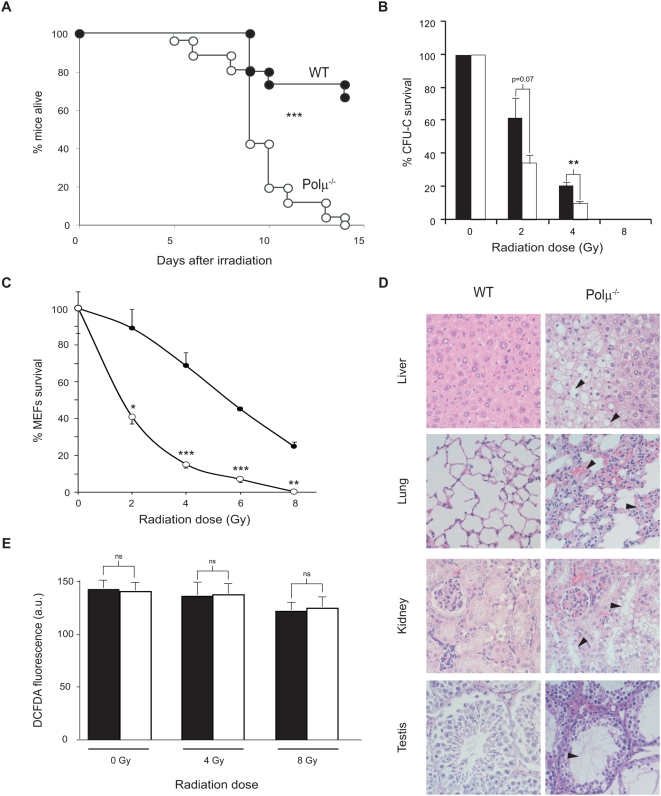
Polymerase micro (Polmicro) is an error-prone, DNA-directed DNA polymerase that participates in non-homologous end-joining (NHEJ) repair. In vivo, Polmicro deficiency results in impaired Vkappa-Jkappa recombination and altered somatic hypermutation and centroblast development. In Polmicro(-/-) mice, hematopoietic development was defective in several peripheral and bone marrow (BM) cell populations, with about a 40% decrease in BM cell number that affected several hematopoietic lineages. Hematopoietic progenitors were reduced both in number and in expansion potential. The observed phenotype correlates with a reduced efficiency in DNA double-strand break (DSB) repair in hematopoietic tissue. Whole-body gamma-irradiation revealed that Polmicro also plays a role in DSB repair in non-hematopoietic tissues. Our results show that Polmicro function is required for physiological hematopoietic development with an important role in maintaining early progenitor cell homeostasis and genetic stability in hematopoietic and non-hematopoietic tissues.


Conflict of interest statement

The authors have declared that no competing interests exist.

Figures

Figure 1
Figure 1. Blood and bone marrow cell profiles are altered and bone marrow cell numbers reduced in Polμ−/− mice.
A. Blood cell populations in wildtype (WT: n = 6–12; solid bars) and Polμ−/− mice (n = 7–13; open bars). CD19, B lymphocytes; CD3, T lymphocytes; Mac1+Gr1, monocytes; and Mac1+Gr1+, neutrophils. B. Representative experiment showing platelet numbers in WT (solid bar; n = 6) and Polμ−/− mice (open bar; n = 16). C. Representative experiment showing distribution of bone marrow (BM) populations (two femurs per mouse) in WT (closed circles; n = 4–7) and Polμ−/− mice (open circles; n = 4–8). D. Histological sections of Polμ−/− and WT BM; endothelial sinusoids are delineated by a dashed line (blue) and marked by blue arrowheads. E. BM cell population analysis by flow cytometry (WT, solid bars; n = 7; Polμ−/−, open bars; n = 8), showing B220 (B cell) and CD3 (T cell), Mac1Gr1 (myelomonocytic), Ter119 (erythroid), and CD41 (megakaryocytic) lineages. F. Representative flow cytometry plots of B cell differentiation analysis in the bone marrow of WT (red plots) or Polμ−/− (blue plots) C57BL/6 mice. PreB+ProB cells were further analyzed according to CD25 and CD43 expression to distinguish between PreB and ProB cells. G. Cell number per bone marrow (2 tibias, 2 femur) of the B cell subsets analyzed in F; n = 8. H. Frequency (percentage of total B cell population) of the B cell subsets analyzed in F; n = 8. Results are pooled data from two independent experiments. Data are means+/−SEM. *: p<0.05; **: p<0.01; ***: p<0.001.
Figure 2
Figure 2. Hematopoietic progenitor and stem cell numbers are reduced in Polμ−/− mice.
A. Number of myeloid progenitors (colony forming units) per bone marrow determined in clonogenic assays in WT (solid bars, n = 9–11) and Polμ−/− (open bars, n = 9–11) mice. CFU-GM (granulomonocytic cells), CFU-G (granulocytes), CFU-M (monocytes) and CFU-C (sum of CFU-GM, CFU-G and CFU-M cells). B. Number of CFU-PreB progenitors. C. Megakaryocyte colony-forming units (CFU-Mk). D. Number of erythroid burst-forming units (BFU-E). BFU-E were scored only if hemoglobin was evident within the colony. E. Flow cytometric determination of CLP (common lymphoid progenitors) in bone marrow of WT (closed circles, n = 8) or Polμ−/− (open circles, n = 8) C57BL/6 mice (left panel). F. Flow cytometric determination of bone marrow CMP (common myeloid progenitors), myelomonocytic progenitors (GMP) and megakaryocyte/erythroid progenitors (MEP) from WT (solid bar, n = 8) and Polμ−/− (open bar, n = 8) C57BL/6 mice (left panel). G. Flow cytometric determination of HSC in the bone marrow of the same mice analyzed in F; WT (solid bar, n = 8) and Polμ−/− (open bar, n = 8) C57BL/6 mice (left panel). Gating strategies for the analysis in E–G are indicated in the plots to the right. H. Experimental design for the competitive bone marrow transplantation assay. I. Frequency of competing repopulating units (RU) in the bone marrow of C57BL/6 wild-type (n = 4) or Polμ−/− mice (n = 4). J. Number of competing repopulating units (RU) per bone marrow of the mice analyzed in I. Data are means+/−SEM. *: p<0.05; **: p<0.01; ***: p<0.001.
Figure 3
Figure 3. Polμ deficiency reduces the proliferation potential of hematopoietic progenitors.
A. Left panel: estimated size (planar surface) of CFU-PreB and CFU-C colonies derived from WT BM (solid bar) and Polμ−/− BM (open bar). Right panel: Micrographs of representative CFU-PreB colonies derived from WT and Polμ−/− BM, showing the reduced colony size of Polμ−/− colonies. B. Numbers of myeloid (left) and erythroid (right) progenitors recovered after 4 days expansion of WT BM (solid bars, (n = 7) and Polμ−/− BM (open bars, (n = 7) in IL3 and SCF supplemented medium. C. Left: Absolute cell numbers, per culture, recovered after a 2 week expansion of WT (solid, (n = 5) and Polμ−/− (open, (n = 4) long-term bone marrow cell cultures (LTBMC). Right: representative micrographs of stroma generated in WT and Polμ−/− LTBMC (3 weeks). Data are means+/−SEM. *: p<0.05; **: p<0.01; ***: p<0.001.
Figure 4
Figure 4. DSB repair is impaired in Polμ−/− mice.
A. Numbers of γ-H2AX foci staining per nuclei in WT (solid bar) or Polμ−/− (open bar) BM and spleen cells. B. Representative confocal images showing γ-H2AX foci (Red, Cy3) in WT and Polμ−/− BM cells (blue staining, DAPI). C. Dot plots showing the comet length of WT (closed squares) and Polμ−/− (open triangles) bone marrow cells. The comet assay was performed in neutral conditions (1×TBE) to assess the relative levels of DNA double strand breakage (DSB). D. Representative fluorescence images of comet assay gels from C. E. Reduced proliferation capacity and premature senescence of cultured Polμ−/− MEF. The 3T3 growth assays show the cumulative increase cell number versus passage in primary (passage 3 at the start of the experiment) WT (closed squares) and Polμ−/− (open triangles) cells. Note that WT MEF enter senescence around division 10, but Polμ−/− MEF stop proliferating by division 4. F. Representative image of a Polμ−/− MEF metaphase spread stained by TEL-FISH. The telomeres are stained with a FITC-labeled (Green) PNA probe and chromosomes are counterstained with DAPI (blue). Asterisks indicate specific chromosomal defects: br (break), r (radial configuration). All data are means+/−SEM. *: p<0.05; **: p<0.01; ***: p<0.001.
Figure 5
Figure 5. Polμ−/− mice show increased radiosensitivity.
A. Survival of Polμ−/− (open circles) and WT mice (closed circles) after whole-body γ-irradiation (9 Gy); n = 15. B. Percentage survival by γ-irradiated WT (solid bars) and Polμ−/− (open bars) bone marrow CFU-C progenitors; n = 4 mice analyzed in duplicate assays. C. Percentage survival by γ-irradiated WT (closed circles) and Polμ−/− (open circles) mouse embryonic fibroblasts (MEF); The figure shows one experiment with each point assayed in quadruplicate. D. Photomicrographs of formalin-fixed, paraffin-embedded, hematoxylin-eosin-stained sections of liver, lung, kidney and testis from irradiated WT and Polμ−/− mice. Note extensive damage (arrowheads) in Polμ−/− tissues: vacuolar degeneration (liver); inflammation and hemorrhaging (lung) and tubular degeneration (kidney and testis). E. Flow cytometry ROS measurements by DCFDA fluorescence in irradiated and mock-irradiated WT (solid bars) and Polμ−/− bone marrow cells (open bars); n = 3. There was no significant difference in ROS levels between WT and Polμ−/− cells under basal conditions or upon irradiation. All data are means+/−SEM. *: p<0.05; **: p<0.01; ***: p<0.001.
Figure 6
Figure 6. Polμ−/− hematopoietic progenitor cells have a reduced capacity for DSB repair.
A. Number of γ-H2AX foci per nucleus in bone marrow and spleen cells from WT (solid bars) and Polμ−/− (open bars) γ-irradiated mice (5Gy); staining was performed 1 hour post-irradiation. B. Representative confocal images showing γ-H2AX foci (Red, Cy3; blue, DAPI) in WT and Polμ−/− bone marrow cells treated as in A. C. Western blot showing amounts of phosphorylated γ-H2AX protein in LPS stimulated wt and Polμ−/− splenocytes after γ-irradiation (8 Gy), and analyzed at different periods (1 h, 3 h, and 6 h) post-irradiation; NI: non-irradiated controls. Histone H3 was used as a loading control. D. Dot plot showing DNA comet tail moment of WT (closed squares) and Polμ−/− (open triangles) bone marrow cells retrieved from irradiated mice (5Gy) after 3 hours of in vivo DNA repair. Tail momentum was significantly increased in Polμ−/− cells. E. Representative images of irradiated WT and Polμ−/− bone marrow metaphase cells analyzed by telomere FISH 96 hours after irradiation. Telomeres were hybridized with a Cy-3 labeled PNA Probe (Red) and chromosomes counterstained with DAPI (blue). Arrows indicate structural chromosomal aberrations: Chd and Chr = chromatid and chromosome breaks, respectively; dic. = dicentric chromosomes. F. Number of breaks, radial configurations, end-to-end-fusions, and total aberrations per metaphase in bone marrow cells from WT (closed bars) and Polμ−/− (open bars) irradiated mice. The mice were γ-irradiated (5Gy) and maintained (6 h) to allow in vivo DNA repair; BM-cell chromosomal aberrations were detected 4 days post irradiation. All data are means+/−SEM. *: p<0.05; **: p<0.01; ***: p<0.001.

Similar articles

Cited by

References

    1. Wyman C, Ristic D, Kanaar R. Homologous recombination-mediated double-strand break repair. DNA Repair (Amst) 2004;3:827–833. - PubMed
    1. Lieber MR, Ma Y, Pannicke U, Schwarz K. Mechanism and regulation of human non-homologous DNA end-joining. Nat Rev Mol Cell Biol. 2003;4:712–720. - PubMed
    1. van Gent DC, Hoeijmakers JH, Kanaar R. Chromosomal stability and the DNA double-stranded break connection. Nat Rev Genet. 2001;2:196–206. - PubMed
    1. Weterings E, van Gent DC. The mechanism of non-homologous end-joining: a synopsis of synapsis. DNA Repair (Amst) 2004;3:1425–1435. - PubMed
    1. Kruger I, Rothkamm K, Lobrich M. Enhanced fidelity for rejoining radiation-induced DNA double-strand breaks in the G2 phase of Chinese hamster ovary cells. Nucleic Acids Res. 2004;32:2677–2684. - PMC - PubMed

Publication types

Substances