. 2009 Jul;15(7):997-1006.
doi: 10.1002/ibd.20880.

Innate immune signaling by Toll-like receptor-4 (TLR4) shapes the inflammatory microenvironment in colitis-associated tumors

Affiliations

Innate immune signaling by Toll-like receptor-4 (TLR4) shapes the inflammatory microenvironment in colitis-associated tumors

Masayuki Fukata et al. Inflamm Bowel Dis. 2009 Jul.

Abstract

Background: Patients with ulcerative colitis are at increased risk for developing colorectal cancer. We have shown that Toll-like receptor-4 (TLR4) is overexpressed in human colitis-associated cancer (CAC) and that mice deficient in TLR4 are markedly protected against colitis-associated neoplasia. We wished to elucidate the specific contributions of TLR4 signaling by myeloid cells and colonic epithelial cells (CEC) in colitis-associated tumorigenesis.

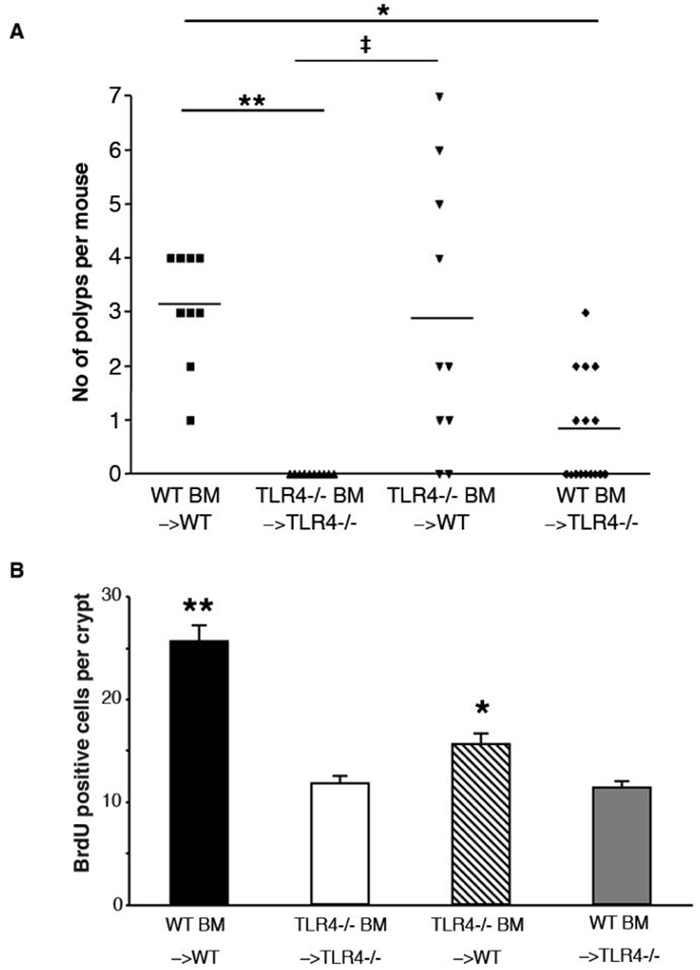
Methods: TLR4-deficient mice or wildtype littermates (WT) were transplanted with bone marrow (BM) cells: TLR4(-/-) BM-->WT mice (TLR4-expressing CEC) and WT BM-->TLR4(-/-) mice (TLR4-expressing myeloid cells). Colitis-associated neoplasia was induced by azoxymethane (AOM 7.3 mg/kg) injection and 2 cycles of dextran sodium sulfate (DSS) treatment.

Results: The number and size of dysplastic lesions were greater in TLR4(-/-) BM-->WT mice than in WT BM-->TLR4(-/-) mice (P < 0.005). Histologically, TLR4(-/-) BM-->WT mice had greater numbers of mucosal neutrophils and macrophages compared to WT BM-->TLR4(-/-) mice. The chemokines KC and CCL2, important in recruitment of neutrophils and macrophages, respectively, were induced in mice expressing TLR4 in CEC rather than the myeloid compartment. The lamina propria infiltrate of mice expressing TLR4 in CEC was characterized by macrophages expressing Cox-2. Moreover, mice expressing TLR4 in CEC rather than the myeloid compartment had increased production of amphiregulin and EGFR activation.

Conclusions: These findings indicate that TLR4 signaling on CEC is necessary for recruitment and activation of Cox-2-expressing macrophages and increasing the number and size of dysplastic lesions. Our results implicate innate immune signaling on CEC as a key regulator of a tumor-promoting microenvironment.


Figures

Figure 1
Figure 1. Incidence of dysplasia
A. The number of dysplastic lesions was counted per mouse. Data are gathered from five independent experiments. Bar represents mean (**P < 0.001, *P < 0.01, P < 0.05). B. Intestinal epithelial proliferation. BrdU labeling index was defined by counting BrdU positive epithelial cells per crypt. Data are represented as mean ±SEM. TLR4-/-BM→WT mice (n=10) had greater epithelial proliferation than WT BM→TLR4-/- mice (n=16)(*P<0.001), but less epithelial proliferation than WT BM→WT mice (n=9) (**P<0.0001). Epithelial proliferation in WT BM→TLR4-/- mice was similar to TLR4-/-BM→TLR4-/- mice (n=8).
Figure 2
Figure 2. Characterization of the tumor microenvironment
A. Microscopic findings in TLR4-/- BM→WT mice and WT BM→TLR4-/- mice mucosa at day 77 of the AOM-DSS model (H & E staining). TLR4-/- BM→WT mice (top panel) have adeuser inflammatory infiltrate in the mucosa compared with WT BM→TLR4-/-mice (bottom panel). B. CD68 positive cells (macrophages) per HPF (400x) were counted in colon samples from AOM-DSS treated mice. Significantly greater numbers of macrophages were seen in TLR4-/- BM→WT mice (n=10) compared to WT BM→TLR4-/- mice (n=16) in both the tumors and surrounding lamina propria. Three fields per site (cecum, proximal, distal) were examined. Data are represented as mean ±SEM (*P < 0.05).
Figure 3
Figure 3. Cox-2 expression from mucosal macrophages is dependent on TLR4 signaling by CEC
A. Cox-2 expression in the colon of AOM-DSS treated mice. Colonic samples were taken at day 77 in the AOM-DSS model. Cox-2 mRNA expression was analyzed by real time PCR. A significant difference is shown between TLR4-/- BM→WT mice (n=10) and WT BM→TLR4-/- mice (n=16). Cox-2 mRNA expression in WT BM→WT mice (n=9) was also significantly higher than TLR4-/- BM→TLR4-/- mice (n=8) or WT BM→TLR4-/-mice. Data are represented as mean ±SEM of relative values of expression (*P < 0.05). B. PGE2 production by colonic mucosa in the AOM-DSS model. There is a numerical difference but not significant difference between TLR4-/- BM→WT mice (n=10) and WT BM→TLR4-/- mice (n=16). Significant differences were found only between WT BM→WT mice (n=9) and TLR4-/- BM→TLR4-/- mice (n=8). Data are shown as mean ±SEM (*P < 0.05). C. Double immunostaining for Cox-2 (green - FITC) and the macrophage marker CD68 (red - TRITC) in TLR4-/- BM→WT mice (top panel) and WT BM→TLR4-/- mice (bottom panel) mucosa. The majority of Cox-2 expressing cells in the lamina propria are also positive for CD68.
Figure 4
Figure 4. TLR4 signaling by CEC induces the expression of macrophage and neutrophil chemoattractant genes in the AOM-DSS model
A. CCL2 expression in the colonic mucosa measured by real time PCR. Samples were taken at day 77 in the AOM-DSS model. A significant difference is shown between TLR4-/- BM→WT mice (n=10) and WT BM→TLR4-/- mice (n=16). CCL2 mRNA expression in WT BM→WT mice (n=9) was also significantly higher than TLR4-/-BM→TLR4-/- mice (n=8) or WT BM→TLR4-/- mice. Data are represented as mean ±SEM of relative values of expression (*P < 0.05). B. Real time PCR for KC mRNA expression in the colonic mucosa. A significant difference is shown between TLR4-/- BM→WT mice (n=10) and WT BM→TLR4-/- mice (n=16). KC mRNA expression in WT BM→WT mice (n=9) was also significantly higher than TLR4-/- BM→TLR4-/- mice (n=8) or WT BM→TLR4-/- mice. Data are represented as mean ±SEM of relative values of expression (*P < 0.05).
Figure 5
Figure 5. TLR4 signaling by CEC regulates mucosal amphiregulin expression and EGFR activation
A. AR expression in the colon of AOM-DSS model. AR mRNA expression was analyzed by real time PCR in the samples at day 77 in the AOM-DSS model. A significant difference is shown between TLR4-/- BM→WT mice (n=10) and WT BM→TLR4-/- mice (n=16). AR mRNA expression in WT BM→WT mice (n=9) was also significantly higher than TLR4-/- BM→TLR4-/- mice (n=8) or WT BM→TLR4-/- mice. Data are represented as mean ±SEM of relative values of expression (*P < 0.05). B. Western blot analysis of phosphorylated EGFR and total EGFR in the colon. Results from representative samples obtained from two mice per condition are shown. 25 μg/lane of protein was loaded per lane. The membrane was sequentially probed for phospho-EGFR and total EGFR. Phospho-EGFR band intensity was quantified by normalizing with the corresponding EGFR band intensity.

References

    1. Gyde SN, Prior P, Allan RN, et al. Colorectal cancer in ulcerative colitis: a cohort study of primary referrals from three centres. Gut. 1988;29:206–17. - PMC - PubMed
    1. Rhodes JM, Campbell BJ. Inflammation and colorectal cancer: IBD-associated and sporadic cancer compared. Trends Mol Med. 2002;8:10–6. - PubMed
    1. Choi PM, Zelig MP. Similarity of colorectal cancer in Crohn's disease and ulcerative colitis: implications for carcinogenesis and prevention. Gut. 1994;35:950–4. - PMC - PubMed
    1. Eaden JA, Abrams KR, Mayberry JF. The risk of colorectal cancer in ulcerative colitis: a meta-analysis. Gut. 2001;48:526–35. - PMC - PubMed
    1. Itzkowitz SH, Harpaz N. Diagnosis and management of dysplasia in patients with inflammatory bowel diseases. Gastroenterology. 2004;126:1634–48. - PubMed

Publication types

MeSH terms