

The stay/switch model of concurrent choice
- PMID: 19230510
- PMCID: PMC2614816
- DOI: 10.1901/jeab.2009.91-21
The stay/switch model of concurrent choice
Abstract
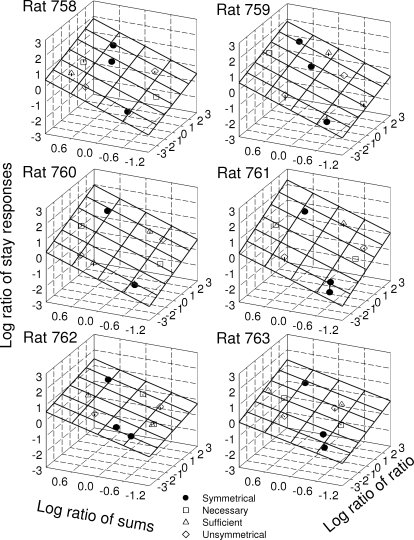
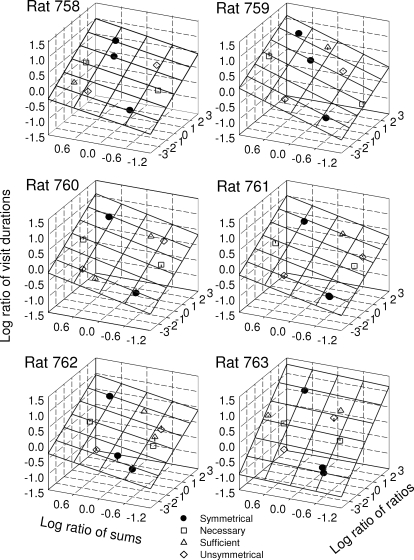
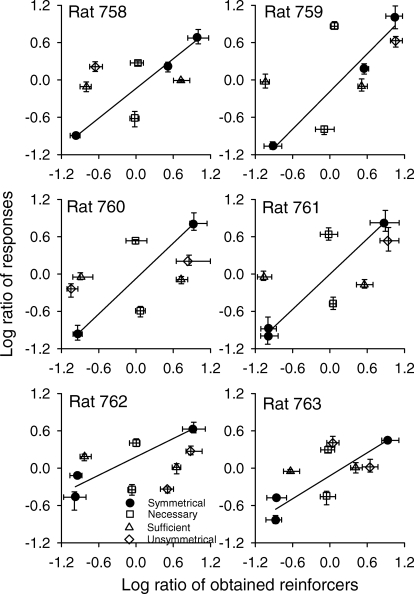
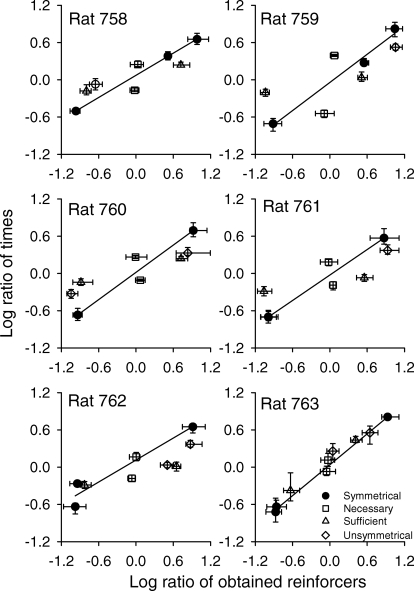
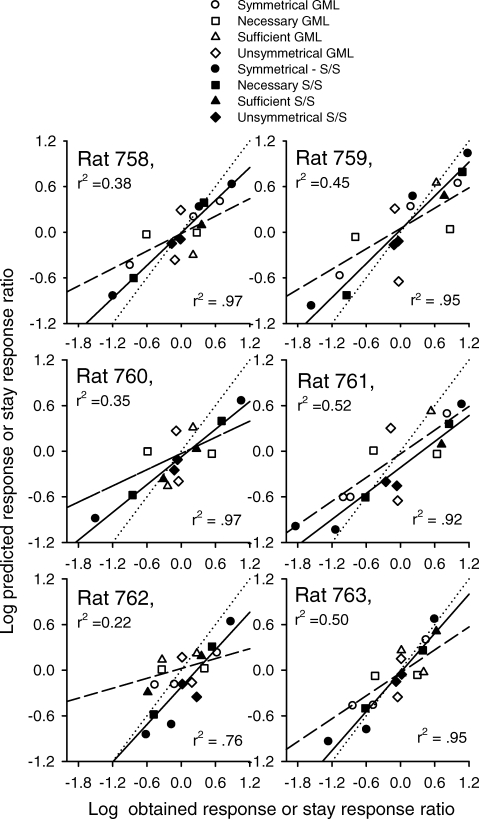
This experiment compared descriptions of concurrent choice by the stay/switch model, which says choice is a function of the reinforcers obtained for staying at and for switching from each alternative, and the generalized matching law, which says choice is a function of the total reinforcers obtained at each alternative. For the stay/switch model two schedules operate when at each alternative. One arranges reinforcers for staying there and the other arranges reinforcers for switching from there. Rats were exposed to eight or nine conditions that differed in the arrangement of the values of the stay and switch schedules. The generalized matching law described preferences when arrangements were similar to those found when using two concurrently running interval schedules. It did not, however, describe all preferences when using different arrangements. The stay/switch model described all preferences in one analysis. In addition, comparisons of selected conditions indicated that changing the ratio of obtained reinforcers was neither necessary nor sufficient for changing preference as measured by response ratios. Taken together these results provide support for the stay/switch model as a viable alternative to the generalized matching law and that the critical independent variable is allocation of stay and switch reinforcers.
Figures
Similar articles
-
The stay/switch model describes choice among magnitudes of reinforcers.Behav Processes. 2008 Jun;78(2):173-84. doi: 10.1016/j.beproc.2008.03.002. Epub 2008 Mar 21. Behav Processes. 2008. PMID: 18406545 Free PMC article.
-
Synthesizing concurrent interval performances.J Exp Anal Behav. 2000 Sep;74(2):189-206. doi: 10.1901/jeab.2000.74-189. J Exp Anal Behav. 2000. PMID: 11029022 Free PMC article.
-
An alternative to the stay/switch equation assessed when using a changeover-delay.Behav Processes. 2015 Nov;120:40-9. doi: 10.1016/j.beproc.2015.08.007. Epub 2015 Aug 20. Behav Processes. 2015. PMID: 26299548 Free PMC article.
-
The effect of conditioned reinforcement rate on choice: a review.J Exp Anal Behav. 2007 May;87(3):409-21. doi: 10.1901/jeab.2007.44-06. J Exp Anal Behav. 2007. PMID: 17575906 Free PMC article. Review.
-
A review of the concurrent-chains arrangement to assess intervention choice: 2018-2023.J Appl Behav Anal. 2024 Mar;57(2):319-330. doi: 10.1002/jaba.1059. Epub 2024 Feb 1. J Appl Behav Anal. 2024. PMID: 38299638 Review.
Cited by
-
Fractionating choice: A study on reward discrimination, preference, and relative valuation in the rat (Rattus norvegicus).J Comp Psychol. 2016 May;130(2):174-86. doi: 10.1037/com0000034. Epub 2016 Apr 14. J Comp Psychol. 2016. PMID: 27078079 Free PMC article.
-
Obese and lean Zucker rats demonstrate differential sensitivity to rates of food reinforcement in a choice procedure.Physiol Behav. 2012 Dec 25;108:19-27. doi: 10.1016/j.physbeh.2012.10.001. Epub 2012 Oct 6. Physiol Behav. 2012. PMID: 23046726 Free PMC article.
-
The identities hidden in the matching laws, and their uses.J Exp Anal Behav. 2010 Mar;93(2):247-60. doi: 10.1901/jeab.2010.93-247. J Exp Anal Behav. 2010. PMID: 20885813 Free PMC article.
-
Preference as a function of active interresponse times: a test of the active time model.J Exp Anal Behav. 2011 Sep;96(2):215-25. doi: 10.1901/jeab.2011.96-215. J Exp Anal Behav. 2011. PMID: 21909165 Free PMC article.
-
An Information Theoretic Approach to Model Selection: A Tutorial with Monte Carlo Confirmation.Perspect Behav Sci. 2019 Jun 19;42(3):583-616. doi: 10.1007/s40614-019-00206-1. eCollection 2019 Sep. Perspect Behav Sci. 2019. PMID: 31976451 Free PMC article.
References
-
- Akaike H. A new look at statistical model identification. IEEE Transactions Automatic Control. 1974;19:716–722.
Publication types
MeSH terms
Grants and funding
LinkOut - more resources
Full Text Sources
