

Conditional reinforcers and informative stimuli in a constant environment
- PMID: 19230511
- PMCID: PMC2614817
- DOI: 10.1901/jeab.2009.91-41
Conditional reinforcers and informative stimuli in a constant environment
Abstract
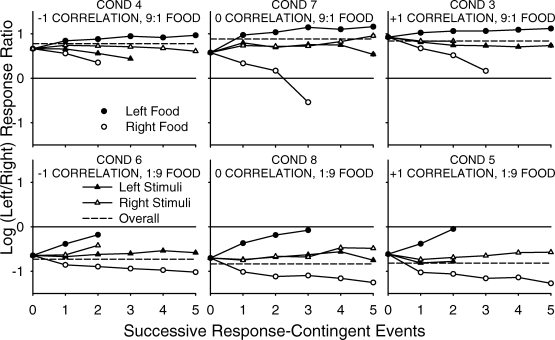
Five pigeons responded on steady-state concurrent variable-interval variable-interval schedules of food presentation in which half of the foods were removed and replaced with nonfood stimuli. Across conditions, the stimuli were either paired or unpaired with food, and the correlation between the ratio of food deliveries on the two alternatives and the ratio of nonfood stimuli was either -1, 0, or +1. Neither the pairing of stimuli with food, nor the correlation between stimuli and food, affected generalized-matching performance, but paired stimuli had a demonstrable effect at a local level of analysis. This effect was independent of the food-stimulus correlation. These results differ from results previously obtained in a frequently changing environment. We attribute this difference in results to differences in the information value of response-contingent stimuli in frequently changing versus relatively constant environments, as well as to differences between forward pairing and simultaneous pairing of the stimuli with food.
Figures


Similar articles
-
Contingent stimuli signal subsequent reinforcer ratios.J Exp Anal Behav. 2011 Jul;96(1):39-61. doi: 10.1901/jeab.2011.96-39. J Exp Anal Behav. 2011. PMID: 21765545 Free PMC article.
-
Stimulus effects on local preference: stimulus-response contingencies, stimulus-food pairing, and stimulus-food correlation.J Exp Anal Behav. 2010 Jan;93(1):45-59. doi: 10.1901/jeab.2010.93-45. J Exp Anal Behav. 2010. PMID: 20676267 Free PMC article.
-
Matching and conditioned reinforcement rate.J Exp Anal Behav. 2006 Mar;85(2):167-80. doi: 10.1901/jeab.2006.34-05. J Exp Anal Behav. 2006. PMID: 16673824 Free PMC article.
-
Steady-state choice between four alternatives obeys the constant-ratio rule.J Exp Anal Behav. 2015 Jul;104(1):7-19. doi: 10.1002/jeab.157. Epub 2015 May 18. J Exp Anal Behav. 2015. PMID: 25989016
-
Assessing potential reinforcement-like effects of brief stimuli unrelated to food reinforcers.J Exp Anal Behav. 2020 Mar;113(2):363-389. doi: 10.1002/jeab.580. Epub 2020 Jan 13. J Exp Anal Behav. 2020. PMID: 31930510
Cited by
-
Reinforcement: food signals the time and location of future food.J Exp Anal Behav. 2011 Jul;96(1):63-86. doi: 10.1901/jeab.2011.96-63. J Exp Anal Behav. 2011. PMID: 21765546 Free PMC article.
-
Contingent stimuli signal subsequent reinforcer ratios.J Exp Anal Behav. 2011 Jul;96(1):39-61. doi: 10.1901/jeab.2011.96-39. J Exp Anal Behav. 2011. PMID: 21765545 Free PMC article.
-
Emergent stimulus relations depend on stimulus correlation and not on reinforcement contingencies.J Exp Anal Behav. 2011 May;95(3):327-42. doi: 10.1901/jeab.2011.95-327. J Exp Anal Behav. 2011. PMID: 21547070 Free PMC article.
-
Information: theory, brain, and behavior.J Exp Anal Behav. 2013 Nov;100(3):408-31. doi: 10.1002/jeab.49. Epub 2013 Oct 4. J Exp Anal Behav. 2013. PMID: 24122456 Free PMC article.
-
Stimulus effects on local preference: stimulus-response contingencies, stimulus-food pairing, and stimulus-food correlation.J Exp Anal Behav. 2010 Jan;93(1):45-59. doi: 10.1901/jeab.2010.93-45. J Exp Anal Behav. 2010. PMID: 20676267 Free PMC article.
References
-
- Caraco T, Lima S.L. Survival, energy budgets, and foraging risk. In: Commons M.L, Kacelnik A, Shettleworth S.J, editors. Quantitative Analyses of Behavior: Foraging. Hillsdale, NJ: Lawrence Erlbaum Associates; 1987. (Vol. 6, pp. 1–21).
MeSH terms
LinkOut - more resources
Full Text Sources
