. 2009 Feb 24;19(4):335-40.
doi: 10.1016/j.cub.2009.01.041.

Characterization and coding of behaviorally significant odor mixtures

Affiliations

Characterization and coding of behaviorally significant odor mixtures

Jeffrey A Riffell et al. Curr Biol. .

Abstract

For animals to execute odor-driven behaviors, the olfactory system must process complex odor signals and maintain stimulus identity in the face of constantly changing odor intensities [1-5]. Surprisingly, how the olfactory system maintains identity of complex odors is unclear [6-10]. We took advantage of the plant-pollinator relationship between the Sacred Datura (Datura wrightii) and the moth Manduca sexta[11, 12] to determine how olfactory networks in this insect's brain represent odor mixtures. We combined gas chromatography and neural-ensemble recording in the moth's antennal lobe to examine population codes for the floral mixture and its fractionated components. Although the floral scent of D. wrightii comprises at least 60 compounds, only nine of those elicited robust neural responses. Behavioral experiments confirmed that these nine odorants mediate flower-foraging behaviors, but only as a mixture. Moreover, the mixture evoked equivalent foraging behaviors over a 1000-fold range in dilution, suggesting a singular percept across this concentration range. Furthermore, neural-ensemble recordings in the moth's antennal lobe revealed that reliable encoding of the floral mixture is organized through synchronized activity distributed across a population of glomerular coding units, and this timing mechanism may bind the features of a complex stimulus into a coherent odor percept.


Figures

Figure 1
Figure 1. Multiunit Responses to GC-Fractionated Odor from the D. wrightii Flower
(A) Schematic representation of a combined GCMR experiment. The floral odor was trapped through dynamic headspace sorption and eluted with a solvent (hexane). The floral extract was injected in the heated injection port of the gas chromatograph, thereby volatilizing the sample. The effluent from the column was split such that half of the flow enters the gas chromatograph’s flame-ionization detector, which ionizes compounds and produces a voltage signal. The other half of the effluent was carried by a heated transfer line and arrived simultaneously at the moth’s antenna. Action potentials from the AL neural ensemble were continuously recorded extracellularly during the 20 min of odor delivery via GC. (B) Rate histograms (bin size, 100 ms) of unit responses to the eluting compounds from the D. wrightii headspace extract (1 μl injection) (bottom trace). Each unit was recorded from one of the four shanks on the electrode recording array, with the Roman numeral denoting the shank number, and number corresponding to the unit on that shank. Certain odorants (e.g., benzyl alcohol (bol, odorant 24) and nerol (ner, odorant 26) evoked significant responses in units on different shanks. (C) Ensemble representations for each odorant eluted from the gas chromatograph. The top plot shows the chromatogram with each peak corresponding to an odorant (numbered on the x axis). Odorants 28 and 33 (geraniol and trans-β-ocimene, respectively) constituted 81% of the total odorant concentration. Only the excitatory responses with a response index (RI) ≥ 2.0 SDs are shown for clarity (color scale). Note that the ensemble responses clustered around a small group of nine odorants (23–31; outlined by a white box) within the floral headspace. Odorant number corresponds to the retention time, except for those odorants that gave robust responses (odorants 23–31), which were rearranged for clarity. (D) The percentage of responsive units in each ensemble (threshold RI ≥ 2.0) was determined for each odorant in the floral headspace and plotted for each preparation (n = 16). Ensemble responses to odorants 23–31 are framed by a white box for clarity. (E) A threshold of 2 standard deviations (dotted line) of the entire data set was used to identify the odorants that evoked the greatest activity: benzaldehyde (bea), benzyl alcohol (bol), linalool (lin), nerol (ner), β-myrcene (myr), methyl salicylate (mal), geraniol (ger), caryophyllene (car), and α-farnesene (far). The asterisk denotes a significant difference (multiple comparisons: p < 0.05) between odorants 23–31 and a majority of the remaining odorants (47/51).
Figure 2
Figure 2. Odor-Modulated Flight Behavior as a Response to Mixtures
(A) Top: Moths’ flight tracks to the mixtures (synthetic mixture containing nine components, two-component mixture of bea and bol, and the natural floral odor) and the single odorants. Note the straight trajectories of the moth flight track to the nine-component mixture and D. wrightii scent. Each circle corresponds to a time point of 16.6 ms. Bottom: Percentage of moths feeding from the odor source. n = 20–50 moths per odor stimulus treatment. (B) Left: The effects of mixture concentration on feeding behavior of moths. Mixtures 0.001–1 yielded results not significantly different from one another (post-hoc Fisher’s test: p > 0.22). Asterisks denote a significant difference from the (negative) mineral-oil control (G test: **p < 0.01). Right: Image of a naive male moth feeding from a paper flower loaded with the nine-component odor mixture (image courtesy of C. Hedgcock).
Figure 3
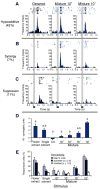
Figure 3. Unit Responses to Mixtures and Single Odorants
(A–C) Units that showed similar (“hypoadditive”) (A), synergistic (B), or suppressive (C) responses to the mixture (middle and right-most columns) relative to the single odorants (left-most column) that evoked the greatest responses. For these three units (each from a different preparation), geraniol elicited the greatest response. Gray bars denote the stimulus duration (200 ms). There was a delay of 350 ms delay from the odor onset to the time the stimulus reached the preparation. Note that the suppression- and synergy-evoked responses changed with mixture concentration. (D) The response indices (RIs) of those units that showed synergy to the initial mixture concentration. Values are the means ± SEM. Letters denote a significant difference (p < 0.05) between odor stimuli. (E) Percentage of units responsive to the individual odorants and mixtures. Unit responses were further repartitioned into the percentage of cells activated (z ≥ −2.0) and inhibited (z ≤ 2.0) by the odorants or mixtures. Values are the means ± SEM.
Figure 4
Figure 4. Spatiotemporal Processing of Odor Mixtures
(A) Spatial activity and synchrony between units. The spatial response pattern for the 15-unit ensemble is represented as a circular matrix in which individual units are ordered clockwise starting from the 12:00 position (unit I-1). Each unit is represented as a circle around the perimeter of the matrix, and its RI is represented by the circle color (see color scale). Also shown are the synchrony patterns (solid, dashed, and dotted lines connecting unit pairs) that underlie the ensemble response to each stimulus; each connecting line represents the synchrony (after shuffle correction) between specific unit pairs. (B) The color-coded response matrix from a 14-unit ensemble (different preparation from [A] recorded after stimulation with the different odorants and mixtures (columns). (C) Pair-wise correlations between mixtures (reference stimuli) and between single odorants and mixtures (comparison stimuli) on the basis of the spatial distribution of activated units in the ensemble shown in (B). Correlation coefficients between odor pairs are color coded. (D) The dissimilarity indices of the mixtures to one another (blue bars) or to the single odorants (gray bars) on the basis of the spatial distribution of activated units (n = 8 preparations). Values are the means ± SEM. (E) The synchrony coefficients (SI%) of unit pairs in response to behaviorally effective mixtures (blue) and single odorants (yellow). Note that both mixtures and single odorants elicited SI values > 30% in individual unit pairs. (F) The pair-wise correlation of the ensemble synchrony patterns between different odor stimuli (from example shown in [E]). (G) The disimilarity indices between mixture-evoked (blue bars) and single-odorant-evoked (gray bars) synchrony patterns for all animals (n = 8 moths) and units (n = 113, 750 unit pairs). Values are the means ± SEM. Asterisks denote a significant difference (Mann-Whitney U test: p < 0.05) between mixtures and single odorants.

References

    1. Bartelt RJ, Schaner AM, Jackson LL. cis-Vaccenyl acetate as an aggregation pheromone in Drosophila melanogaster. J Chem Ecol. 1985;11:1747–1756. - PubMed
    1. Boch R, Shearer DA. Identification of geraniol as the active component in the Nassanoff pheromone of the honey bee. Nature. 1962;194:704–706. - PubMed
    1. Kaissling KE. Peripheral mechanisms of pheromone reception in moths. Chem Senses. 1996;21:257–268. - PubMed
    1. Laska M, Fendt M, Wieser A, Endres T, Hernandez Salazar LT, Apfelbach R. Detecting danger – or just another odorant? Olfactory sensitivity for the fox odor component 2,4,5-trimethylthiazoline in four species of mammals. Physiol Behav. 2005;84:211–215. - PubMed
    1. Williams IH, Pickett JA, Martin AP. The Nasonov pheromone of the honey bee Apis mellifera L. (Hymenoptera, Apidae). Part II Bioassay of the components using foragers. J Chem Ecol. 1981;7:225–237. - PubMed

Publication types

Substances

LinkOut - more resources