. 2009 Apr;30(4):335-41.
doi: 10.1016/j.placenta.2009.01.007. Epub 2009 Feb 23.

Differential expression of fibulin family proteins in the para-cervical weak zone and other areas of human fetal membranes

Affiliations

Differential expression of fibulin family proteins in the para-cervical weak zone and other areas of human fetal membranes

R M Moore et al. Placenta. 2009 Apr.

Abstract

Objective: Human fetal membranes (FM) at term have been shown to contain a weak zone in the region overlying the cervix which exhibits characteristics of increased collagen remodeling and apoptosis. It has been hypothesized that the FM rupture initiation site is within this weak zone. Although the FM weak zone has been partially characterized, it is unclear what structural differences in the extracellular matrix result in its decreased rupture strength. A screen for differentially expressed proteins in the amnion of the weak zone versus other FM areas demonstrated that fibulin 1 was decreased. We investigated potential regional differences in all fibulin protein family members.

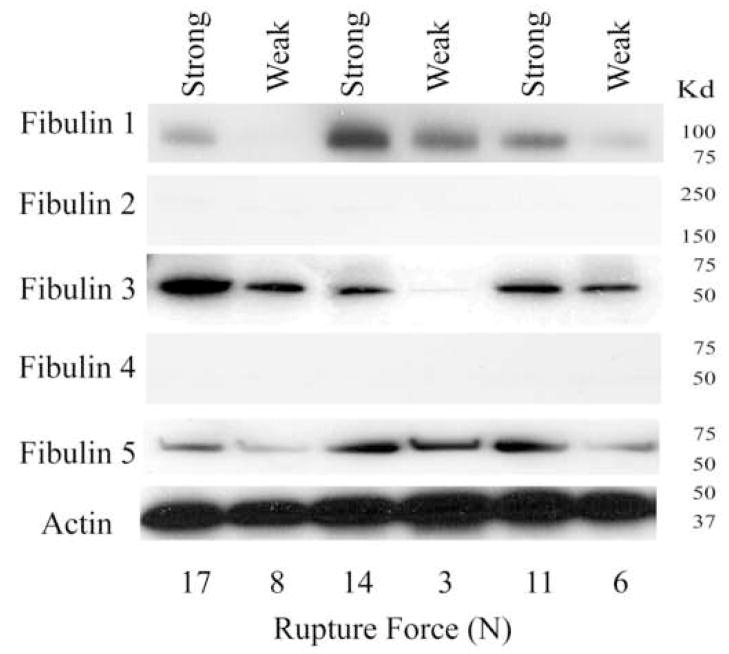
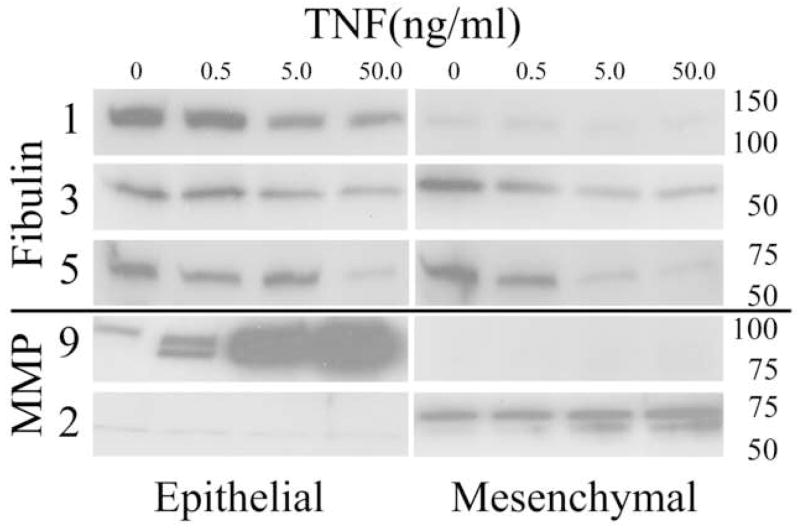
Methods: FM fibulins were localized by immunohistochemistry. Detected fibulins were screened by Western blot for differences in abundance in the amnion of the weak zone versus non-weak zone FM regions. Amnion epithelial and mesenchymal cells were also screened for fibulin production.

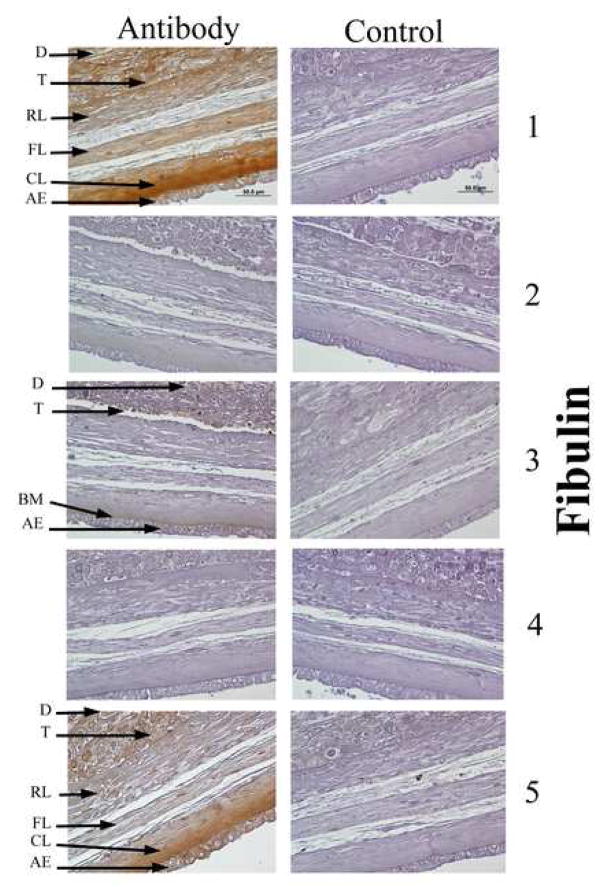
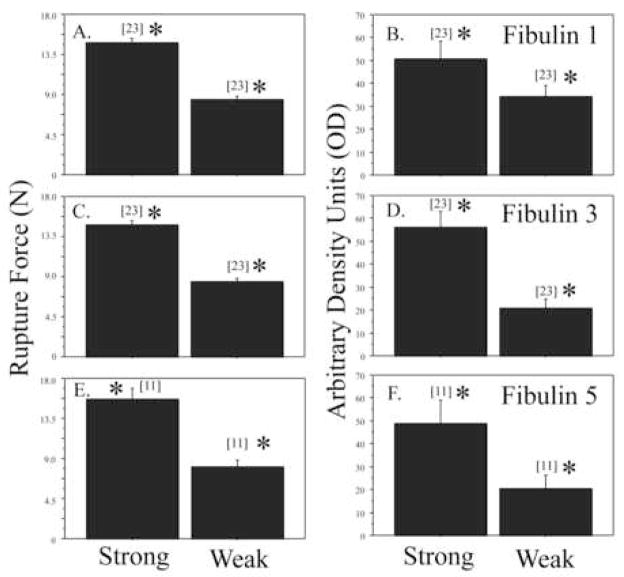
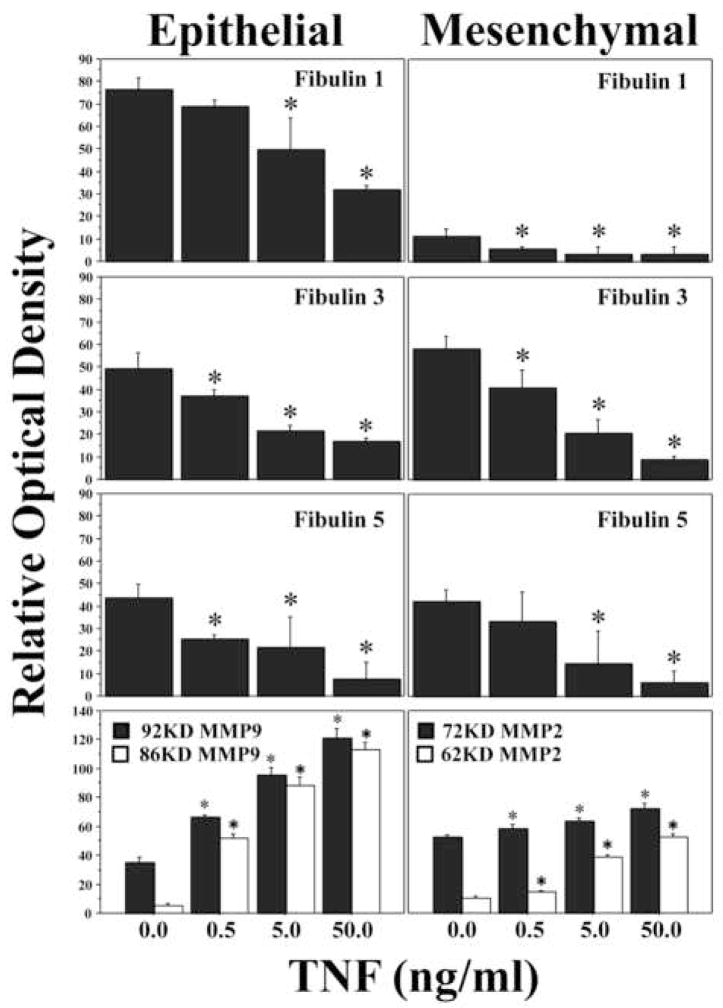
Results: Fibulins 1 and 5 were detected in the cytoplasm of and in a pericellular pattern surrounding all FM cells, and in a dense extracellular pattern in the amniotic compact zone. Fibulin 3 was detected within the cytoplasm of amnion epithelial and chorion trophoblast cells. Fibulins 2 and 4 were not detected. Fibulins 1, 3 and 5 demonstrated decreased abundance of 33%, 63% and 58% (all P<0.01) in amnion of the weak zone relative to other FM regions. Amnion cells produced all three detected fibulins. Furthermore, TNF inhibited amnion cell fibulin production in a dose dependent manner.

Conclusion: Fibulins 1, 3 and 5 were localized coincident with major microfibrillar networks in amnion. Each showed decreased abundance in the amnion component of the FM weak zone. Amnion epithelial and mesenchymal cells produced all three fibulins and their abundance was inhibited by TNF. We speculate that the amnion microfibrillar layer undergoes significant remodeling with the development of the FM weak zone.


Figures

Figure 1
Figure 1
Immunohistochemical localization of fibulin proteins in intact FM: Localization of immuno-reactive (brown staining) fibulin family members 1–5 are shown in representative cross-sections of fetal membranes (left panel). Pre-treatment of sections with blocking peptides against fibulin antibodies prior to incubation (right panel). Abbreviations: AE amnion epithelial layer, BM basement membrane, CL compact layer, D decidua, FL fibroblast layer, RL reticular layer, T trophoblast (magnification 600X).
Figure 2
Figure 2
Fibulin protein expression in amnion from para-cervical weak zone and other FM areas: Panels indicate Fibulin 1–5 protein expression, as assessed by western blot analysis, of amnion from FM fragments from the para-cervical weak zone and other FM areas from three representative patients. Actin expression is shown for comparison of protein loading. Rupture force in Newtons (N) for each fragment is indicated along the bottom.
Figure 3
Figure 3
Comparison of rupture force and fibulin protein expression in para-cervical weak zone and other FM areas: Rupture force in Newtons (A, C, E) for intact FM fragments, and fibulin 1, 3 and 5 protein expression (B, D, F) in the amnion component from these intact fragments, as assessed by western blot analysis, are shown. Note that the number of samples in each group appears above each bar [n] and differences between fragments from the para-cervical weak zone and other FM areas for rupture force, as well as fibulin expression, for each group is statistically significant (* P<0.01).
Figure 4
Figure 4
Fibulin expression is down-regulated by TNF in cultured amnion cells: TNF treatment (0–50ng/ml) of cultured amnion epithelial (left panel) or amnion mesenchymal cells (right panel) for 24h induced a dose dependent decrease in fibulin 1, 3 and 5 expression in both cell types. Dose dependent induction of MMP9 and MMP2 by TNF in amnion epithelial and mesenchymal cells, respectively, is shown for comparison. A representative western blot from one experiment(4a). Molecular weight markers in KD are indicated on the right. Graphical representation of compiled data (relative optical density: Mean+/−SD) obtained from four scanned western blots (as above) for experiments using amnion cells prepared from four separate FM(4b). TNF dose is indicated along the horizontal axis and relative optical density is shown on the vertical axis. Data is considered significant (*) at P<0.05 (N=4).
Figure 4
Figure 4
Fibulin expression is down-regulated by TNF in cultured amnion cells: TNF treatment (0–50ng/ml) of cultured amnion epithelial (left panel) or amnion mesenchymal cells (right panel) for 24h induced a dose dependent decrease in fibulin 1, 3 and 5 expression in both cell types. Dose dependent induction of MMP9 and MMP2 by TNF in amnion epithelial and mesenchymal cells, respectively, is shown for comparison. A representative western blot from one experiment(4a). Molecular weight markers in KD are indicated on the right. Graphical representation of compiled data (relative optical density: Mean+/−SD) obtained from four scanned western blots (as above) for experiments using amnion cells prepared from four separate FM(4b). TNF dose is indicated along the horizontal axis and relative optical density is shown on the vertical axis. Data is considered significant (*) at P<0.05 (N=4).

Similar articles

Cited by

References

    1. Menon R. Spontaneous preterm birth, a clinical dilemma: etiologic, pathophysiologic and genetic heterogeneities and racial disparity. Acta Obstet Gynecol Scand. 2008;87(6):590–600. - PubMed
    1. Parry S, Strauss JF. Premature rupture of the fetal membranes. N Engl J Med. 1998;338:663–70. - PubMed
    1. Lockwood CJ, Kuczynski E. Markers of risk for preterm delivery. J Perinat Med. 1999;27(1):5–20. - PubMed
    1. Menon R, Fortunato SJ. The role of matrix degrading enzymes and apoptosis in rupture of membranes. J Soc Gynecol Investig. 2004;11(7):427–37. - PubMed
    1. Moore RM, Mansour JM, Redline RW, Mercer BM, Moore JJ. The physiology of fetal membrane rupture: insight gained from the determination of physical properties. Placenta. 2006;27(11–12):1037–51. - PubMed

MeSH terms